
Pressure’s off the Menu! Enjoyable Plating for Healthy Living
Published:

EXECUTIVE SUMMARY
High blood pressure, also known as hypertension, is a common chronic condition affecting millions of people worldwide. It is a major risk factor for cardiovascular disease, stroke, and kidney disease, among other health problems. Diet plays a crucial role in managing hypertension, and people with high blood pressure often struggle to find healthy and tasty recipes that meet their nutritional needs. [1] While there are many recipe websites and software applications available, they do not always provide tailored recommendations for people with specific health conditions such as hypertension. Moreover, some recipes labeled as healthy may not be appropriate for people with high blood pressure due to their sodium content or other ingredients that can exacerbate the condition.
This project focused on helping hypertensive consumers overcome the challenge of adhering to dietary recommendations. As the prevalence of this chronic disease continues to rise globally, proper diet management is crucial. However, patients often struggle to cook healthy and tasty meals that fit their nutritional limitations. To address this problem, our team developed a personalized meal recommender system that takes into account consumers’ nutritional requirements, taste preferences, cooking skills, and other relevant factors. The goal is to enhance the user experience of hypertensive consumers and empower them to make informed and enjoyable food choices.
Recipes, User Ratings, and nutritional values were scraped and extracted from allrecipes.com[2]. Post pre-processing, the recipes, which includes selected ingredients and its corresponding nutritional values, were then vectorized for Term Frequency-Inverse Document Frequency (TF-IDF). Singular Value Decomposition (SVD) was also applied to help identify latent features that are relevant for recipe recommendations. Finally, using K-means clustering method, the recipes were then grouped and labelled as either Sweet Treats or Savory Treats based on the cluster features. Using Neighborhood-based Collaborative Filtering recommendation system method, the algorithm returned recipes that fits the consumers preference. The recommended items were further filtered based on the 2,000 grams sodium threshold as prescribed by WHO for hypertensive individuals. [3]
The team is confident in the potential of this recommendation system, and we have identified several key areas for improvement and expansion such as, but not limited to the following: (1) enhance the customization capturing consumer specific dietary requirements (2) extend the explainability of the recommended recipes to eaters, (3) expand the recommendation system to include other health conditions such as diabetes, cancer, gout, and others, and (4) maximize the impact and reach of our recommendation system through partnerships with food delivery services.
Overall, this project highlighted the potential of data-driven approaches to promote healthier eating habits, especially for those with specific health concerns such as hypertension. By leveraging machine learning techniques and nutritional expertise, we can create personalized recommendations that are both enjoyable and beneficial for individuals’ health.
TABLE OF CONTENTS
PROBLEM STATEMENT
How the world eats is shifting dramatically. The proliferation of different food options alongside technological advancements increased convenience but at the same time lessened consumers’ nutritional awareness. Given this objective in mind, we explored information from allrecipes focusing on this key question that our team seeks to address:
How can we recommend delicious and healthy recipes to promote the well-being of hypertensive eaters?
The team’s primary focus is on developing a recommendation system that can effectively suggest tasty and nutritious recipes to individuals with hypertension. This question addresses the main challenge of balancing the dietary restrictions required to manage hypertension while still promoting enjoyable and satisfying meals.
Several key considerations such as identifying and incorporating relevant nutritional guidelines, capturing user preferences and dietary restrictions, and developing a robust and accurate recommendation algorithm were taken into consideration. However, for the time being, the team will only incorporate the World Health Organization’s 2,000mg daily sodium restriction as the nutritional guideline. By addressing these challenges, the team aims to provide an effective solution to promote the well-being of hypertensive individuals while enjoying their meals.
MOTIVATION
Hypertension, or high blood pressure, is a common medical condition that affects millions of people worldwide, including many of our loved ones. It is a major risk factor for cardiovascular disease, stroke, and other serious health problems, and is a leading cause of premature death globally.
One of the main ways to manage hypertension is through lifestyle modifications, including changes to diet and exercise habits. For many hypertensive individuals, this means adhering to specific dietary restrictions, such as reducing salt intake and increasing consumption of nutrient-rich foods like fruits, vegetables, and whole grains.
However, following these dietary restrictions can be challenging for many patients, especially if they feel that they have to sacrifice flavor or enjoyment in their meals. This is where the team aims to help hypertensive patients come in. By developing a recommendation system that suggests delicious and healthy recipes tailored to their dietary requirements, our team hopes to make it easier for hypertensive individuals to adhere to their restrictions while still enjoying their meals.
This can have significant health benefits for hypertensive patients, as it can help them to maintain a healthy weight, manage their blood pressure, and reduce their risk of developing other health problems associated with hypertension. Overall, the team aims to improve the quality of life and health outcomes for hypertensive individuals by helping them to make tasty and nutritious food choices.
LIST OF TABLES AND FIGURES
Table 1. Description of the Data per DataFrame
Table 2. Features of the Recipes Dataset
Table 3. Features of the Ratings Dataset
Figure 2. Distribution of Ratings per Rating Value
Figure 3. Top 10 Foods with the Most Number of Reviews
Figure 4. Top 10 Foods with the Most Number of Sodium content (in mg)
Figure 5: Top 10 Foods with the Most Number of Sodium content (in mg) per Serving
Figure 6: Top 10 Foods with the Least Number of Sodium content (in mg) per Serving
Figure 7: Cumulative Variance Explained
Figure 8: Results of k-Means Clustering
Figure 9: Results of k-Means Clustering Metrics
Figure 10: Final k-Means Clustering
Figure 11: Hierarchical Clustering Methods
Figure 12: Extracted Cluster Themes
Figure 13: FlavorFit Recommender System
Figure 14: FlavorFit Recommender System for Sweet Treats
Figure 15: FlavorFit Recommender System for Savory Eats
METHODOLOGY
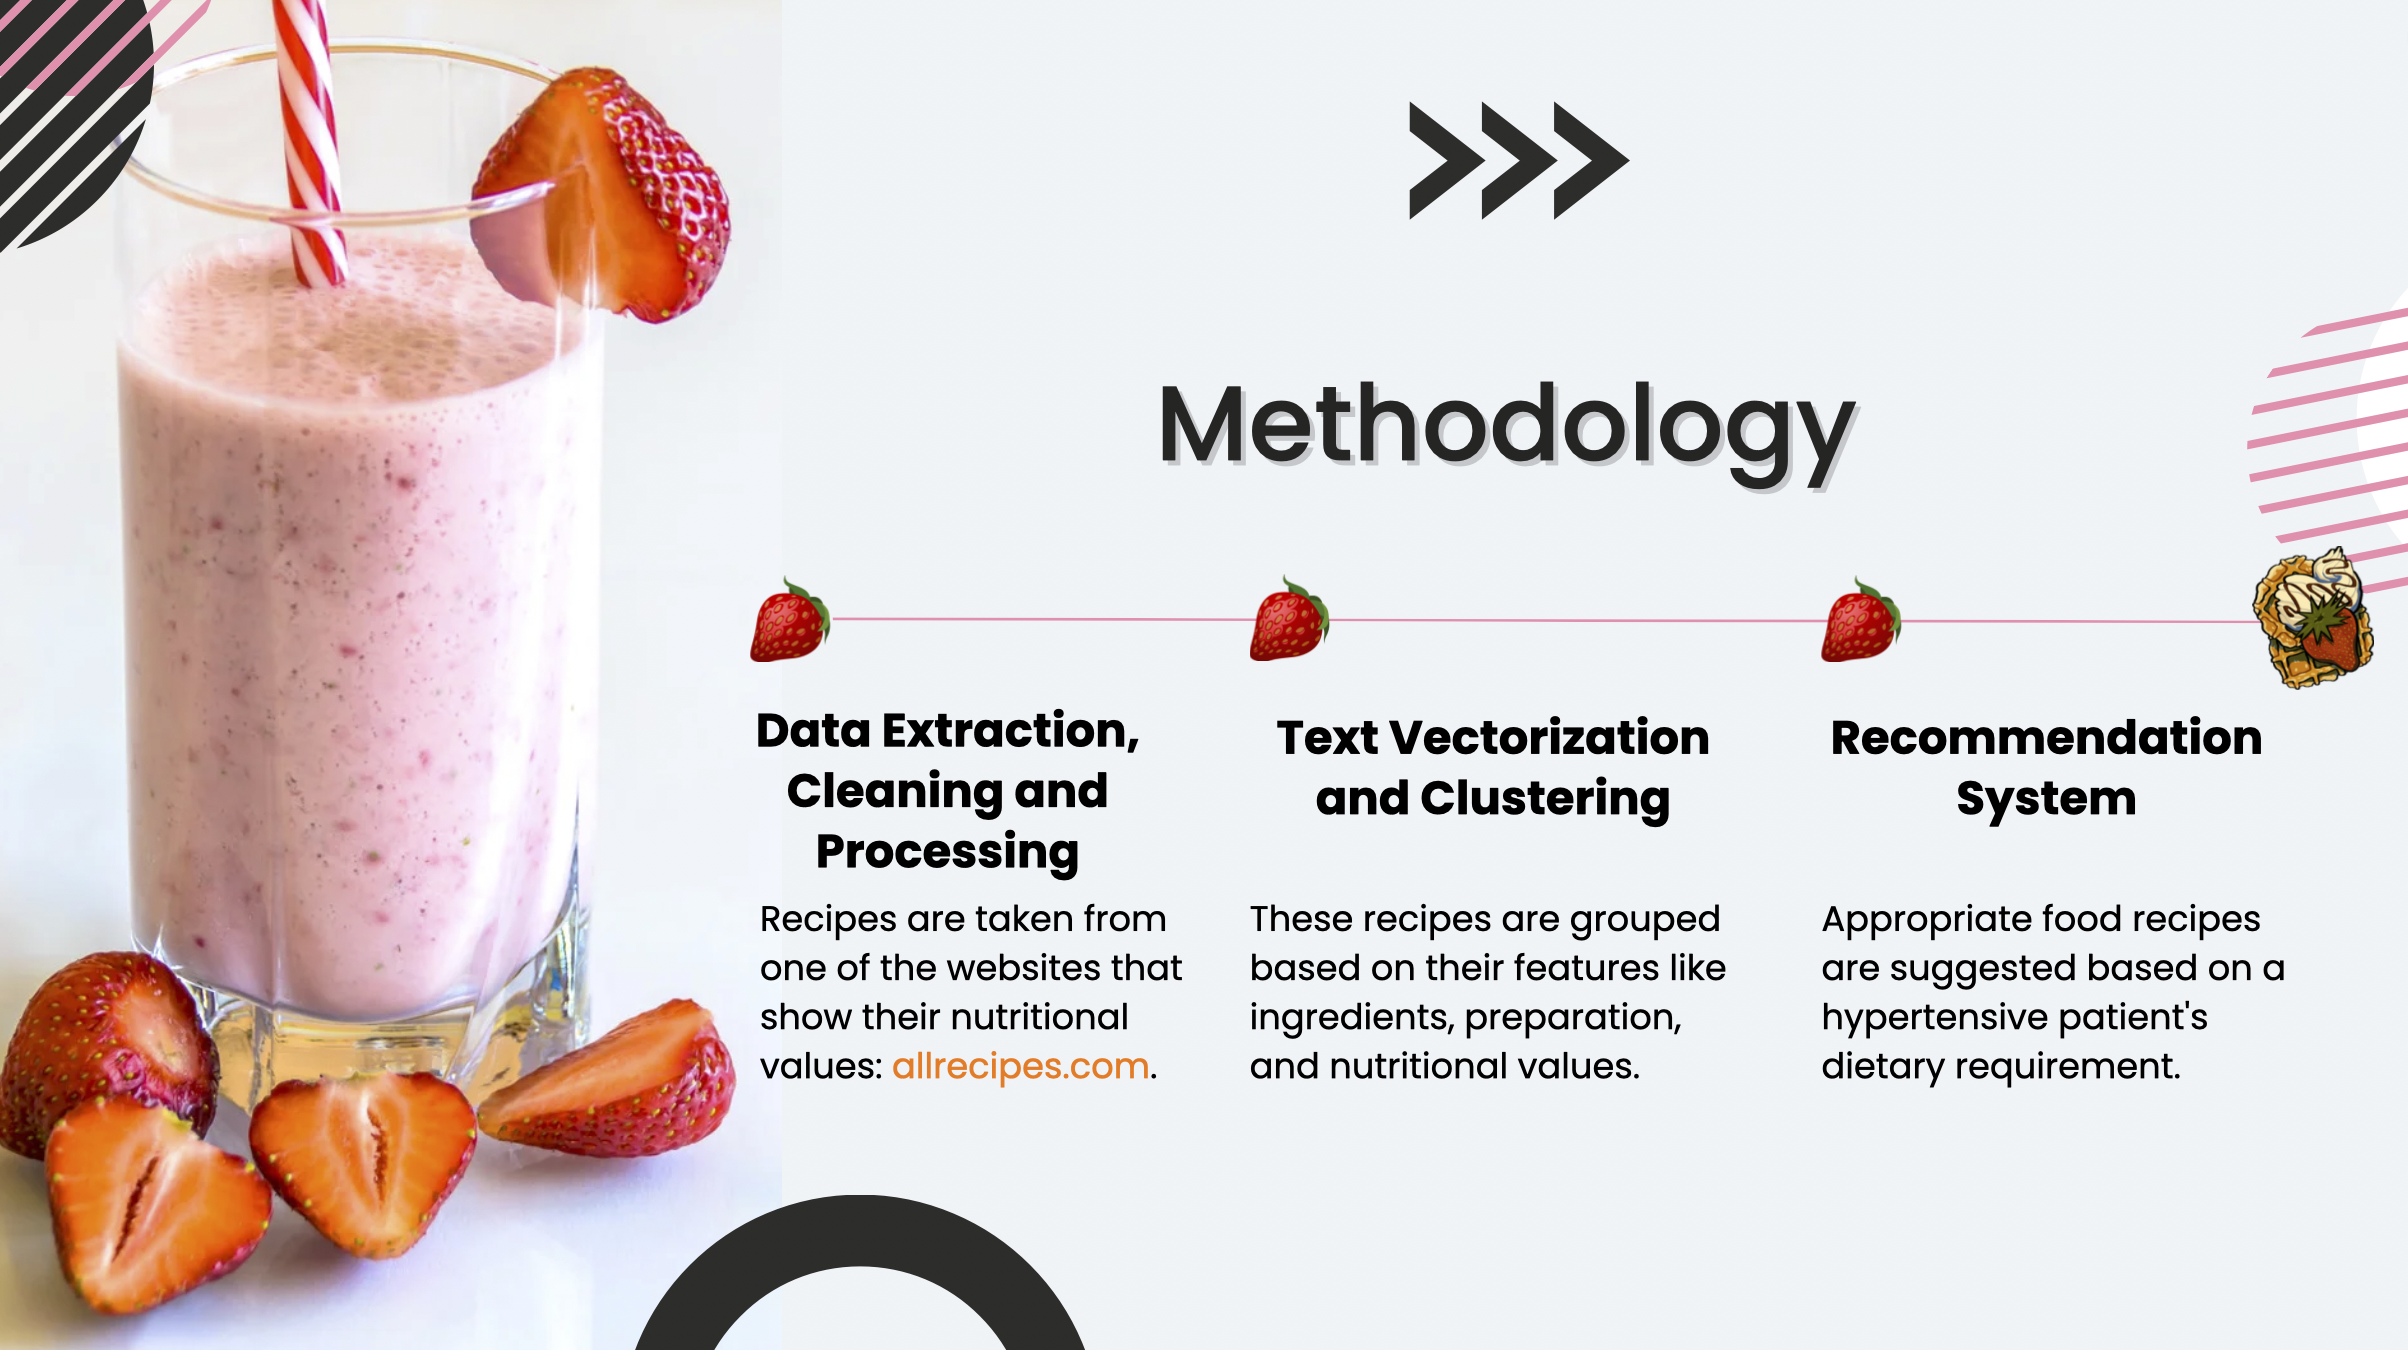
To develop the proposed recipe recommendation system for hypertensive eaters, the following methodology was employed:
1. Data Extraction, Cleaning and Processing:
Data Extraction
The recipes, ratings, and nutrients for this study were extracted from allrecipes.com, a popular recipe website that provides nutritional values for each recipe.
Data Cleaning & Pre-processing
The following cleaning and preprocessing steps were performed to clean the datasets:
- Combined the food and nutrients dataframes.
- Retained only the calories, carbohydrates_g, sugars_g, fat_g, saturated_fat_g, cholesterol_mg, protein_g, dietary_fiber_g, sodium_mg, and calories_from_fat nutrients. Dropped the rest of the nutrients as they either contain null information or will not impact consumers diagnosed with hypertension.
- Retained only the ratings where the food_id is also in the food datarame.
- Cleaned the recipe text by employing lemmatization and removing stopwords unique to the dataset (e.g., chef, easy, make, etc).
2. Text Vectorization and Clustering
The resulting recipes after the data cleaning and pre-procesing stage are then vectorized for Term Frequency-Inverse Document Frequency (TF-IDF). This is to identify the most important or relevant words in a recipe (e.g., key ingredients and/or preparation methods). Afterwhich, Singular Value Decomposition (SVD), a dimensionality reduction technique most often used in recommender systems, was employed to help identify latent features that are relevant for recipe recommendations.
Finally, using K-means clustering method, the recipes are grouped based on their features like ingredients, preparation, and nutritional values.
3. Recommendation System
Using Neighborhood Based Collaborative Filtering method, a machine learning algorithm that makes personalized recommendations based on the preferences and behaviours of similar users, the alogirthm returned recipes that fits the eaters preference in foods. This is then filtered by a 2,000 gram sodium threshold as prescribed by WHO.
DATA SOURCE AND DESCRIPTION
For this project, the team focused on exploring the Recipes and Ratings datasets with detailed features as follows:
| DataFrame | Feature | Data Type | Description |
|---|---|---|---|
food | itemid | int64 | ItemID of the recipe |
food | title | object | Title of the recipe |
food | prep_time | int64 | Preperation time for the recipe |
food | cook_time | int64 | Cooking time for the recipe |
food | ready_time | int64 | Readying time for the recipe |
food | ingredients | object | Ingredients of the recipe |
food | directions | object | Directions of the recipe |
food | url | object | URL of the recipe |
food | photo_url | object | Photo URL of the recipe |
nutrients | name | object | Name of the recipe |
nutrients | url | object | URL of the recipe |
nutrients | category | object | Category of the recipe |
nutrients | author | object | Author of the recipe |
nutrients | summary | object | Summary of the recipe |
nutrients | rating | float64 | Rating per recipe |
nutrients | rating_count | int64 | Rating Count per recipe |
nutrients | review_count | int64 | Review Count per recipe |
nutrients | ingredients | object | Ingredients of the recipe |
nutrients | directions | object | Directions of the recipe |
nutrients | prep | object | Preparation of the recipe |
nutrients | cook | object | Cooking time of each step of the recipe |
nutrients | total | object | Total Cooking Time of the recipe |
nutrients | servings | int64 | Serving size of the recipe |
nutrients | yield | object | Yield of the recipe |
nutrients | calories | float64 | Total Calories of the recipe |
nutrients | carbohydrates_g | float64 | Total Carbohydrates in grams of the recipe |
nutrients | sugars_g | float64 | Total Sugar in grams of the recipe |
nutrients | fat_g | float64 | Total Fat in grams of the recipe |
nutrients | saturated_fat_g | float64 | Total Saturated Fat in grams of the recipe |
nutrients | cholesterol_mg | float64 | Total Cholesterol in milligrams of the recipe |
nutrients | dietary_fiber_g | float64 | Total Dietary fiber in grams of the recipe |
nutrients | sodium_mg | float64 | Total Sodium in milligrams of the recipe |
nutrients | calories_from_fat | float64 | Total Calories from fat of the recipe |
nutrients | calcium_mg | float64 | Total Calcium in milligrams of the recipe |
nutrients | iron_mg | float64 | Total Iron in milligrams of the recipe |
nutrients | magnesium_mg | float64 | Total Magnesium in milligrams of the recipe |
nutrients | potassium_mg | float64 | Total Potassium in milligrams of the recipe |
nutrients | zinc_mg | float64 | Total Zinc in milligrams of the recipe |
nutrients | phosphorus_mg | float64 | Total Vitamin A of the recipe |
nutrients | vitamin_a_iu_IU | float64 | Total Phosphorous in milligrams of the recipe |
nutrients | niacin_equivalents_mg | float64 | Total Niacin Equivalents in milligrams of the recipe |
nutrients | vitamin_b6_mg | float64 | Total Vitamin B6 in milligrams of the recipe |
nutrients | vitamin_c_mg | float64 | Total Vitamin C in milligrams of the recipee |
nutrients | folate_mcg | float64 | Total Folate in microgram of the recipe |
nutrients | thiamin_mg | float64 | Total Thiamin in milligrams of the recipe |
nutrients | riboflavin_mg | float64 | Total Riboflavin in milligrams of the recipe |
nutrients | vitamin_e_iu_IU | float64 | Total Vitamin E of the recipe |
nutrients | vitamin_k_mcg | float64 | Total Vitamin K in micrograms of the recipe |
nutrients | biotin_mcg | float64 | Total Biotin in micrograms of the recipe |
nutrients | vitamin_b12_mcg | float64 | Total Vitamin B12 in micrograms of the recipe |
nutrients | mono_fat_g | float64 | Total Mono Fat in grams of the recipe |
nutrients | poly_fat_g | float64 | Total Poly Fat in grams of the recipe |
nutrients | trans_fatty_acid_g | float64 | Total Trans Fatty Acid in grams of the recipe |
nutrients | omega_3_fatty_acid_g | float64 | Total Omega 3 Fatty Acid in grams of the recipe |
nutrients | omega_6_fatty_acid_g | float64 | Total Omega 3 Fatty Acid in grams of the recipe |
ratings | User_ID | int64 | User ID of the rater |
ratings | Food_ID | int64 | Food ID of the recipe |
ratings | Rating | int64 | Rating of the rater per recipe |
From the above table and as discussed in the methodology that the recipes and nutrients were combined, this project focused on exploring the Recipes and Ratings datasets with detailed features as follows.
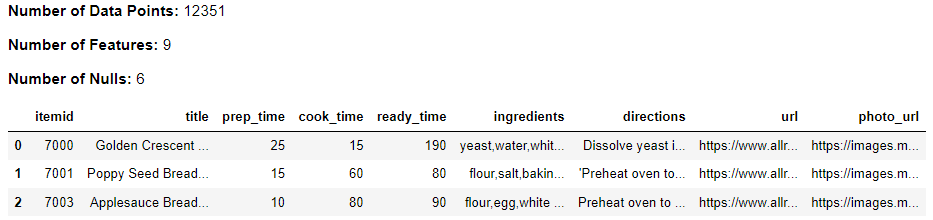
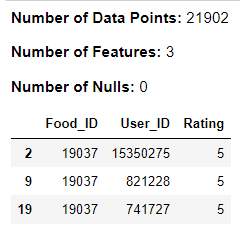
The
Recipesdataset contains 12,351 rows and 14 columns, including detailed information on the nutritional values of each recipe.For this project, we used the following nutritional values per recipe: calories, carbohydrates_g, sugars_g, fat_g, saturated_fat_g, cholesterol_mg, protein_g, dietary_fiber_g, and sodium_mg. These values were documented based on the ingredients used in each recipe, which were sourced from a reliable nutritional database. By incorporating these nutritional values, eaters with specific dietary needs, or even those simply interested in tracking their nutritional intake, will greatly benefit from this. More specifically, by including the sodium content, eaters with hypertension can manage their condition better.
Further, adding nutritional values, including sodium content, can help consumers with hypertension manage their condition better. This information can lead to better health choices and outcomes, improved quality of life, and reduced risk of complications such as heart disease and stroke. Overall, including nutritional values in food recipes is a small but significant step towards a healthier lifestyle for everyone.
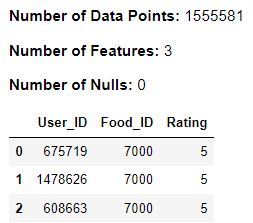
The
Ratingsdataset contains 1,555,581 rows and 3 columns, including User_id and Rating information on each recipe given by users.In order to increase the reliability of the reviews and ensure that they were written by knowledgeable users, we filtered the dataset to only include reviews written by users who had provided feedback more than 100 times. By doing so, we were able to reduce the influence of potentially biased or unreliable reviews, and focus on the feedback provided by experienced reviewers. This filtering process helped us to ensure the overall quality and accuracy of the reviews used in this analysis.
By analyzing these datasets, we aim to gain insights into the nutritional value of popular recipes, identify trends in the types of ingredients and preparation methods used by allrecipes.com users, as well as understand the ratings and user behavior. In the following sections, we will describe the data analysis process and present our findings.
| Features | Data Type | Description |
|---|---|---|
| Food_ID | int | unique identifier of the food item |
| name | string | name of the food item |
| ingredients | string | list of ingredients |
| photo_url | string | URL to a photo of the food item |
| calories | float | total number of calories |
| carbohydrates_g | float | total number of carbohydrates in grams |
| sugars_g | float | total number of sugars in grams |
| fat_g | float | total number of fat in grams |
| saturated_fat_g | float | total number of saturated fat in grams |
| cholesterol_mg | float | total amount of cholesterol in milligrams |
| protein_g | float | total number of protein in grams |
| dietary_fiber_g | float | total number of dietary fiber in grams |
| sodium_mg | float | total amount of sodium in milligrams |
| calories_from_fat | float | total number of calories from fat |
| Features | Data Type | Description |
|---|---|---|
| Food_ID | int | unique identifier for the food item |
| User_id | int | unique identifier for the user who rated the food item |
| Rating | float | rating given by the user for the food item |
DATA EXPLORATION
Data Collection
Allrecipes.com is a popular recipe-sharing website that has been providing home cooks with a vast collection of recipes for over two decades. One of the unique features of allrecipes.com is that it includes nutritional information for many of its recipes. This feature has made it a go-to source for individuals who are looking for healthier meal options or who have specific dietary needs.
In this study, the team scraped selected data from allrecipes.com due to its diverse food options and the availability of nutritional information for majority of its recipes. By leveraging this information, the team could provide more accurate and comprehensive information about the recipes, including nutritional values such as calories, carbohydrates_g, sugars_g, fat_g, saturated_fat_g, cholesterol_mg, protein_g, dietary_fiber_g, and sodium_mg. This information can benefit a wide range of users, from consumers with specific dietary needs to consumers simply interested in tracking their nutritional intake.
Data Preparation
food_raw, nutrients, ratings_raw = dmw2_final.read_data()
The team performed data preparation, cleaning, and preprocessing procedures to ensure the datasets’ quality and appropriateness for subsequent analysis addressing any notable concerns such as missing data or irregular formatting, if any.
Recipe Dataset
Data Preview
dmw2_final.df_exploration(food_raw)
Impute missing values
food_raw = food_raw.bfill(axis=1)
food_raw = food_raw.ffill(axis=1)
dmw2_final.df_exploration(food_raw, display_df=False)
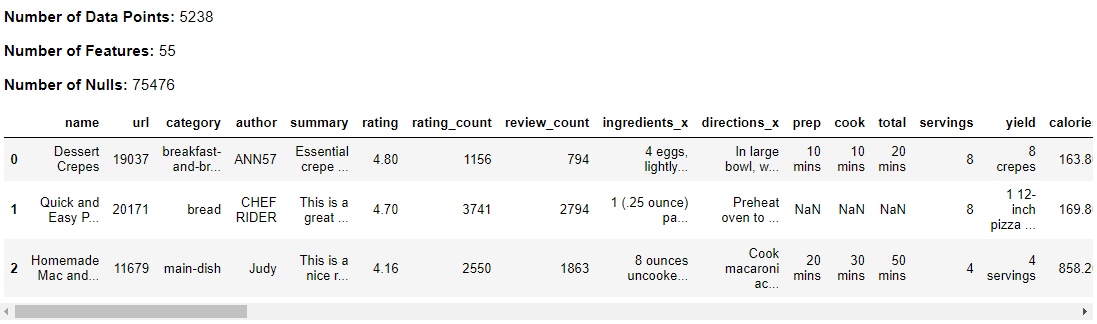
Add Nutritional Values
Nutritional values in food recipes are important for consumers with specific dietary restrictions or personal preferences as this allow consumers to make informed decisions about what to eat based on their varying nutritional needs.
food_nutrients = dmw2_final.add_nutrients(food_raw, nutrients)
dmw2_final.df_exploration(food_nutrients)
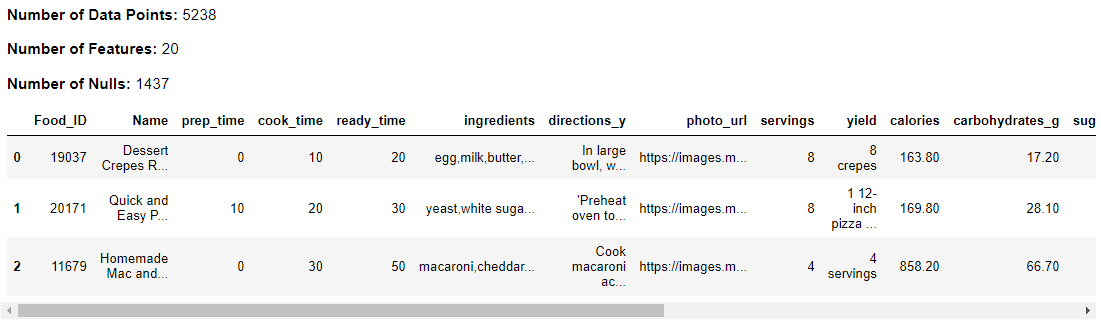
Preview Data with Nutritional Values
df_food = dmw2_final.get_food(food_nutrients)
dmw2_final.df_exploration(df_food)
Impute missing values
df_food = df_food.bfill(axis=1)
df_food = df_food.ffill(axis=1)
dmw2_final.df_exploration(df_food, display_df=False)
Ratings Dataset
Data Preview
dmw2_final.df_exploration(ratings_raw)
 As discussed above, in order to increase the reliability of the reviews and ensure that they were written by knowledgeable users, we filtered the dataset to only include reviews written by users who had provided feedback more than 100 times. By doing so, we were able to reduce the influence of potentially biased or unreliable reviews, and focus on the feedback provided by experienced reviewers.
df_ratings = dmw2_final.get_ratings(ratings_raw, df_food)
dmw2_final.df_exploration(df_ratings)
Exploratory Data Analysis
The team performed in-depth exploration on the datasets discussed above to better comprehend its contents and structures. This critical process ensured that the subsequent analysis will be based on accurate and dependable data.
We took a closer look at the distribution of ratings by plotting the total number of ratings per rating value alongside the percentage of ratings per rating value. By presenting these two metrics side by side, we were able to identify any potential patterns or trends in the data and gain valuable insights into the overall distribution of ratings. This process helped us to identify the most common rating values and determine the most effective way to analyze and interpret the data.
# Calculate the percentage of each rating value
total = df_ratings.Rating.count()
percent_plot = pd.DataFrame({"Total": df_ratings.Rating.value_counts()})
percent_plot.reset_index(inplace=True)
percent_plot.rename(columns={"index": "Rating"}, inplace=True)
percent_plot["Percent"] = percent_plot["Total"].apply(lambda x: (x/total)*100)

# Plot the first bar chart
plt.figure(figsize=(10, 5))
ax1 = plt.subplot(1, 2, 1)
sns.barplot(x="Rating", y="Total", data=percent_plot, color="#808080")
plt.xlabel("Rating")
plt.ylabel("Total")
plt.title("Total Ratings per Rating Value")

# Plot the second bar chart
ax2 = plt.subplot(1, 2, 2)
sns.barplot(x="Rating", y="Percent", data=percent_plot, color="#ff7f0e")
plt.xlabel("Rating")
plt.ylabel("Percent")
plt.title("Percentage of Ratings per Rating Value")

# Save the plot as a PNG file
plt.savefig("plots.png")

# Create an HTML img tag to display the image
img_tag = f'<img src="plots.png" alt="plots" style="display:block;margin-left:auto;margin-right:auto;width:80%;">'

# Display the img tag in the Jupyter Notebook
display(HTML(img_tag))
plt.close()
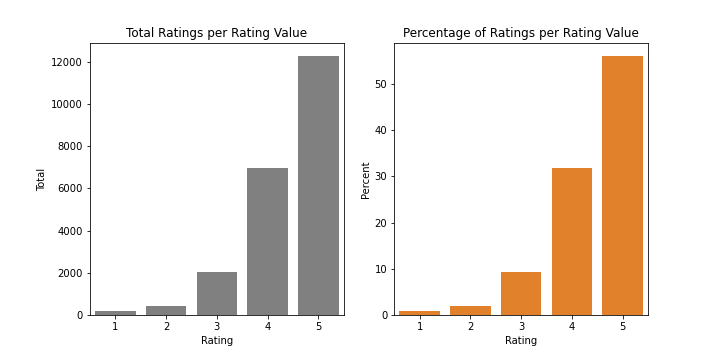
From both the total ratings and percentage of ratings per rating value, we can infer that majority of the dishes in the Recipes datasets have a rating of 5.0. Despite the fact that ratings are subjective, we can deduce that majority of the dishes in our dataset are delicious and approved by the foodies out there.
dmw2_final.display_top_foods(df_ratings, df_food)
Top 10 Foods with the Most Number of Reviews 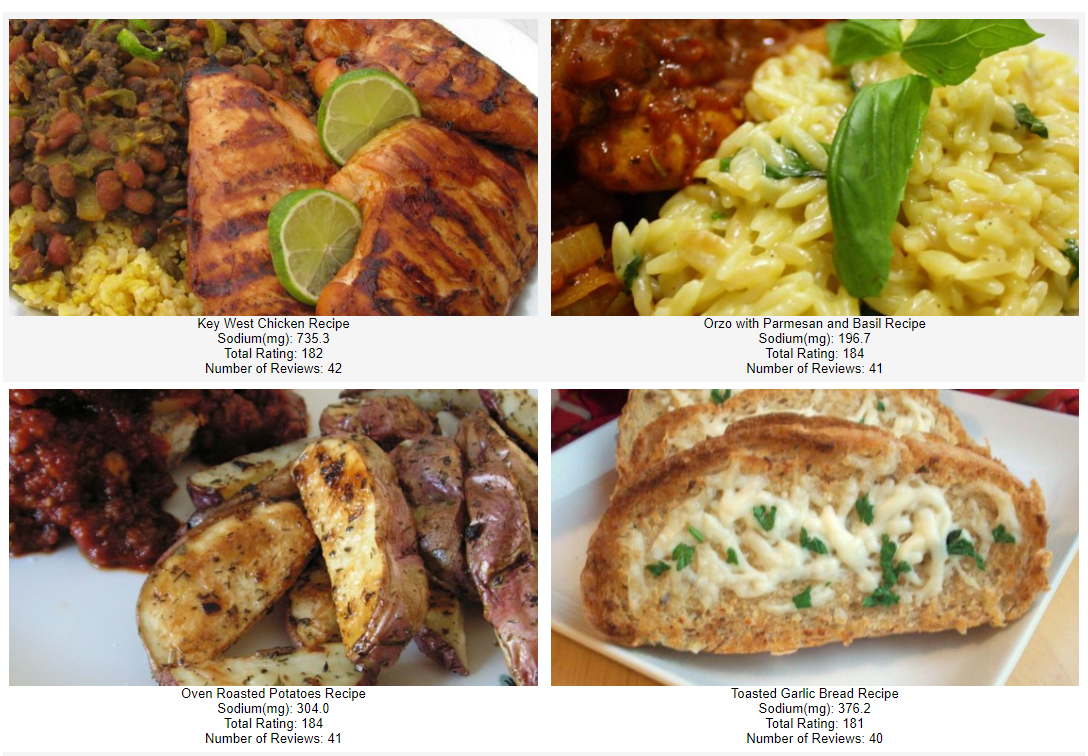
Above list of recipes were the top 10 foods based on how many times each food_id was reviewed. Total Rating depicts the total number of ratings per food. We started by tabulating the frequency of each food_id in the reviews and subsequently included a “total rating” column that displays the total number of reviews for each food item. We then determined the top 10 food items based on the cumulated total number of ratings.
Intuitively, it does follow that as the number of reviews increase, total of the ratings also increases. One notable observation as well is that these dishes with most number of reviews have a sodium content which is within the threshold of 2,000mg.
dmw2_final.display_top_10_sodium(df_food)
Top 10 Foods with theMost Number of Sodium Content (in mg) 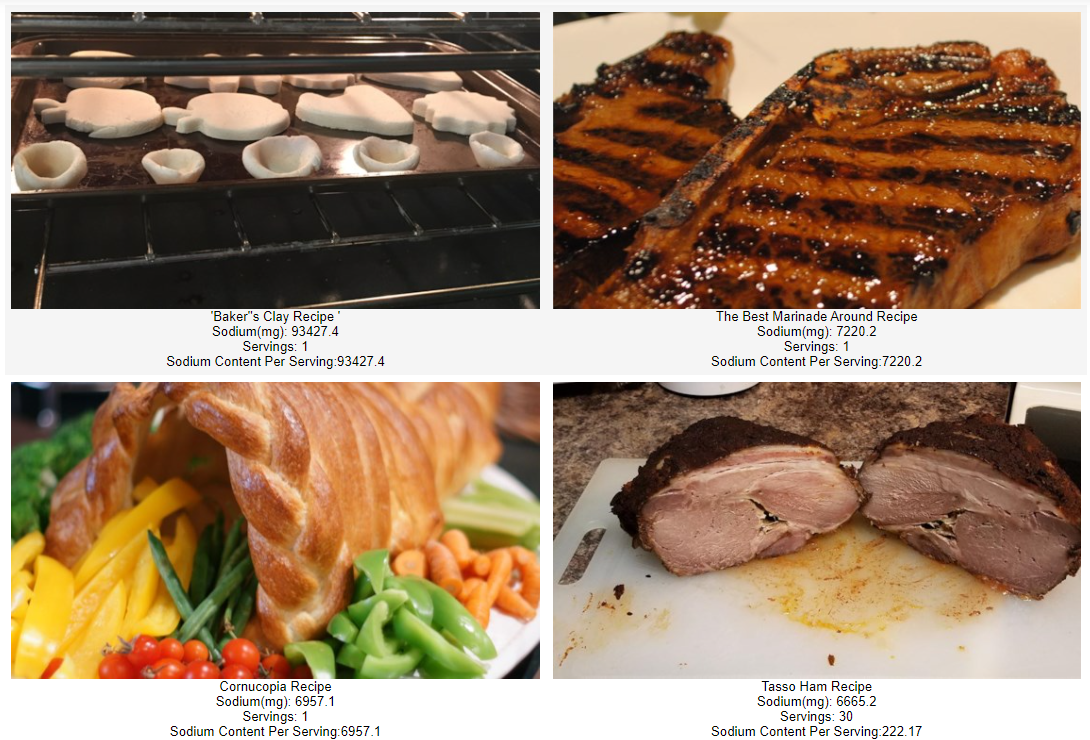
Above list of recipes were the top 10 foods based on their sodium content (in mg). The highest on the list is Baker’s clay, which is from the allrecipes.com website, is used to make non-edible cookies that make lovely ornaments to hang on your Christmas Tree [4]. Its main ingredients are 4 cups of all-purpose flour, 1 1/2 cups water, and 1 cup salt. Given that the sodium content is beyond the 2,000mg threshold, no need to remove this outlier as this will be automatically be removed when recommending recipes to hypertensive eaters.
Other dishes in the list are mostly main dishes with meat as its main ingredient - ribs, steak, ham, others.
dmw2_final.display_top_10_sodium_serving(df_food)
Top 10 Foods with the Most Number ofSodium content (in mg) per Serving 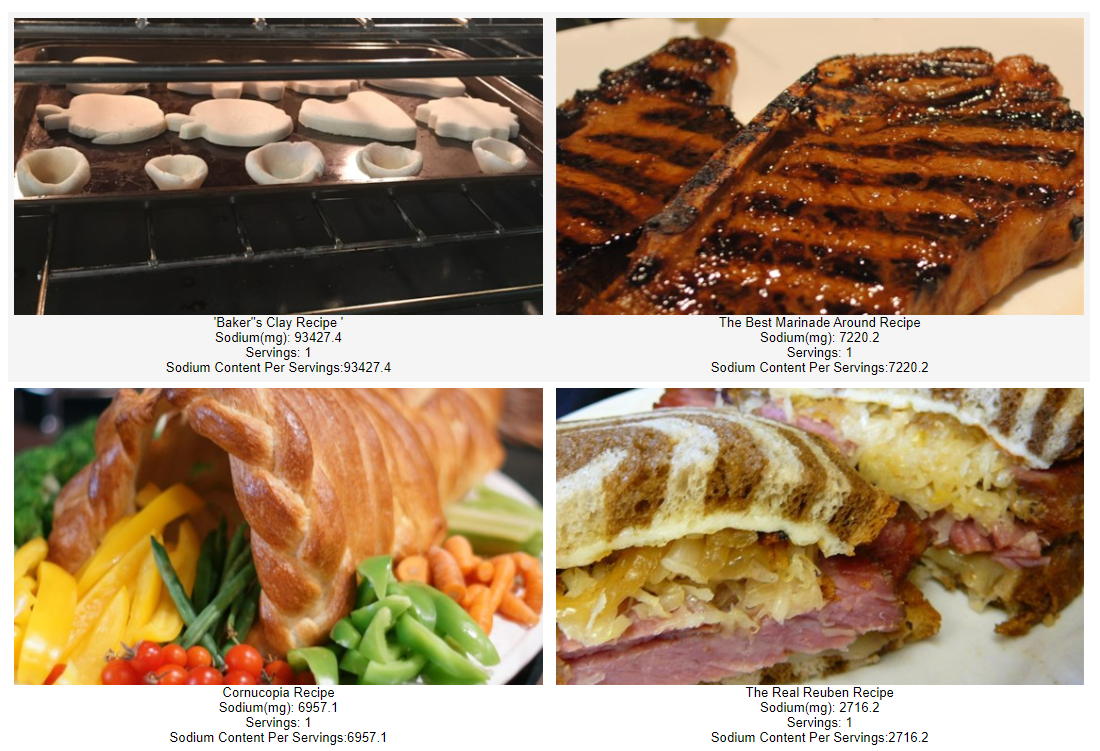
Above list of recipes were the top 10 foods based the sodium content (in mg) per serving. Ignoring Baker’s clay which was already discussed in the previous list of top 10 items, the dishes returned this time are those which are stuffed and sandwich (burger).
dmw2_final.display_low_10_sodium_serving(df_food)
Top 10 Foods with the Least Number ofSodium content (in mg) per serving 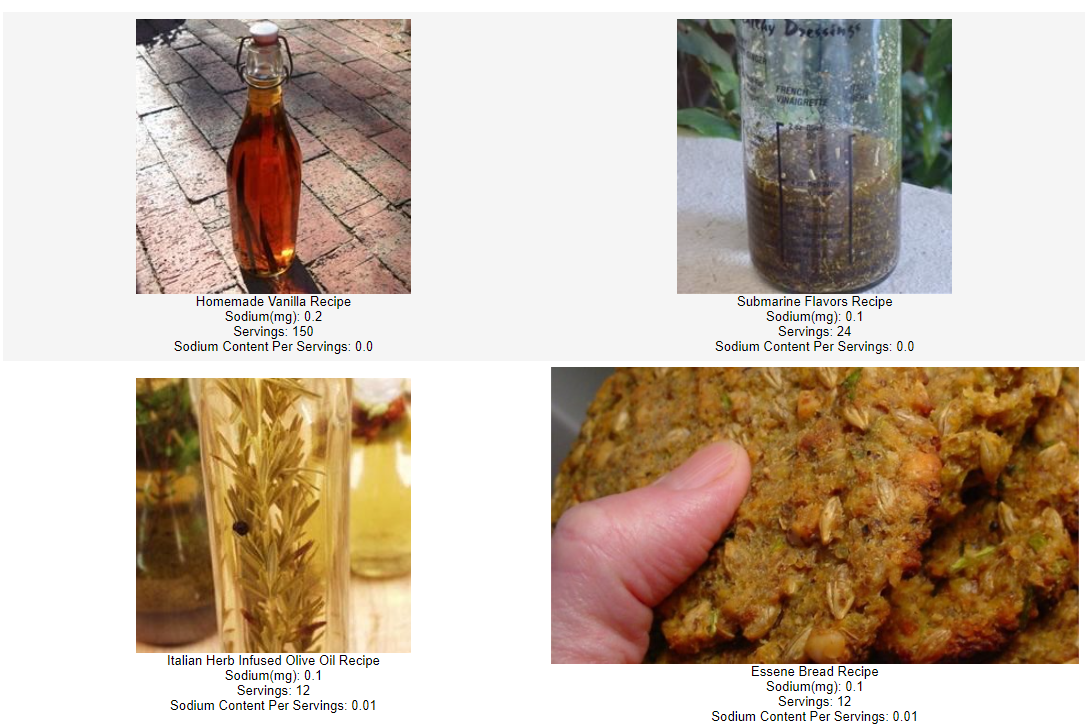
Above list of recipes were the bottom 10 foods based on its sodium content (in mg) per serving. Scanning the returned list of dishes, it does not look appetizing on their own, as it seems that these foods are complementary to other foods or should be eaten together with other dishes.
DIMENSIONALITY REDUCTION
Dimensionality reduction refers to the process of reducing the number of features in a dataset while retaining and being able to explain the variation in the original dataset as much as possible.
For the purpose of this study, given the number and nature of features we have, we used Truncated Singular Value Decomposition since it is recommended for densed data and datasets with sparse data, in which many of the row values are zero. [5] Given that we vectorized the ingredients, the returned dataset was highly sparsed, hence the reason for choosing SVD for dimensionality reduction.
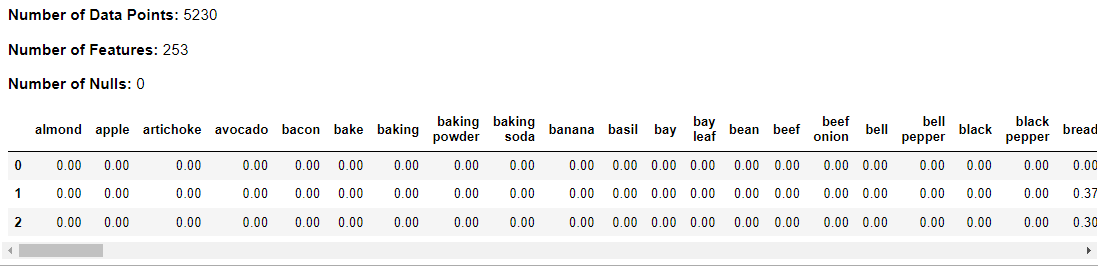
df_corpus = dmw2_final.get_ingredient_matrix(df_food)
dmw2_final.df_exploration(df_corpus)
dmw2_final.plot_variance_explained(df_corpus)
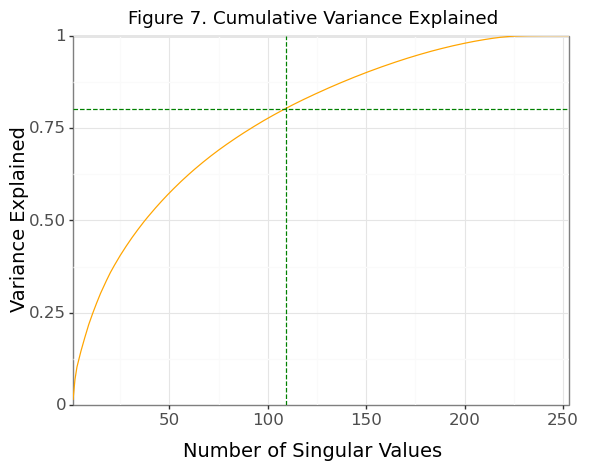
The SVD analysis of a matrix indicated that to explain at least 80% of the variance, 109 components were required based on the cumulative proportion of variance explained by the singular values
df_svs = dmw2_final.perform_svd(dmw2_final.n_sv, df_corpus)
dmw2_final.df_exploration(df_svs)
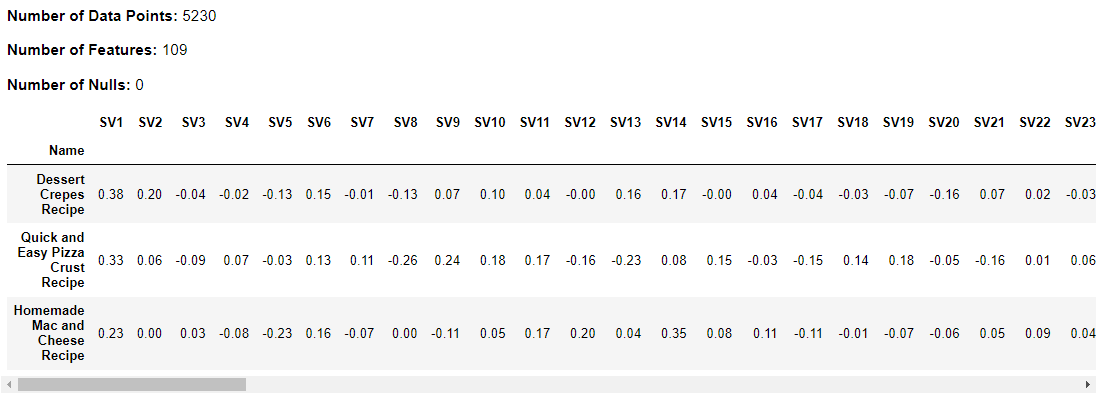 Above table provides a detailed breakdown of all 109 singular values retained and its corresponding weights.
RESULTS
CLUSTERING
We evaluated three different clustering methods:
- k-Means representative-based clustering;
- Complete Linkage hierarchical-based clustering; and
- Ward’s Linkage hierarchical-based clustering.
When selecting the best clustering method for dataset, we took into account below factors:
- results of internal validation metrics such as Silhouette Score, Davies-Bouldin index, and Calinski-Harabasz index;
- evaluation through visual inspection the resulting clusters when projected onto the two selected singular value components of the ingredients dataset; and
- the sensibility of the resulting cluster interpretations based on domain expertise.
After systematically evaluating various clustering techniques, we found that k-Means was the most effective approach for clustering the data, producing superior results in terms of cluster separation and coherence. To optimize the k-Means algorithm, we tested a range of k values ranging from 2 to 11.
On the other hand, for the hierarchical methods, we performed sensitivity analyses on the dendrogram cut-off points. Through this thorough evaluation process, we were able to identify the optimal clustering method for the input data and gain valuable insights into its underlying structure.
K-Means
dmw2_final.evaluate_kmeans_clusters(dmw2_final.final_tsvd)
These are the results of the grid search for the optimal K, which involved 10 iterations.
dmw2_final.show_internal_validation(dmw2_final.silhouette_scores,
                                    dmw2_final.ch_scores,
                                    dmw2_final.db_scores)
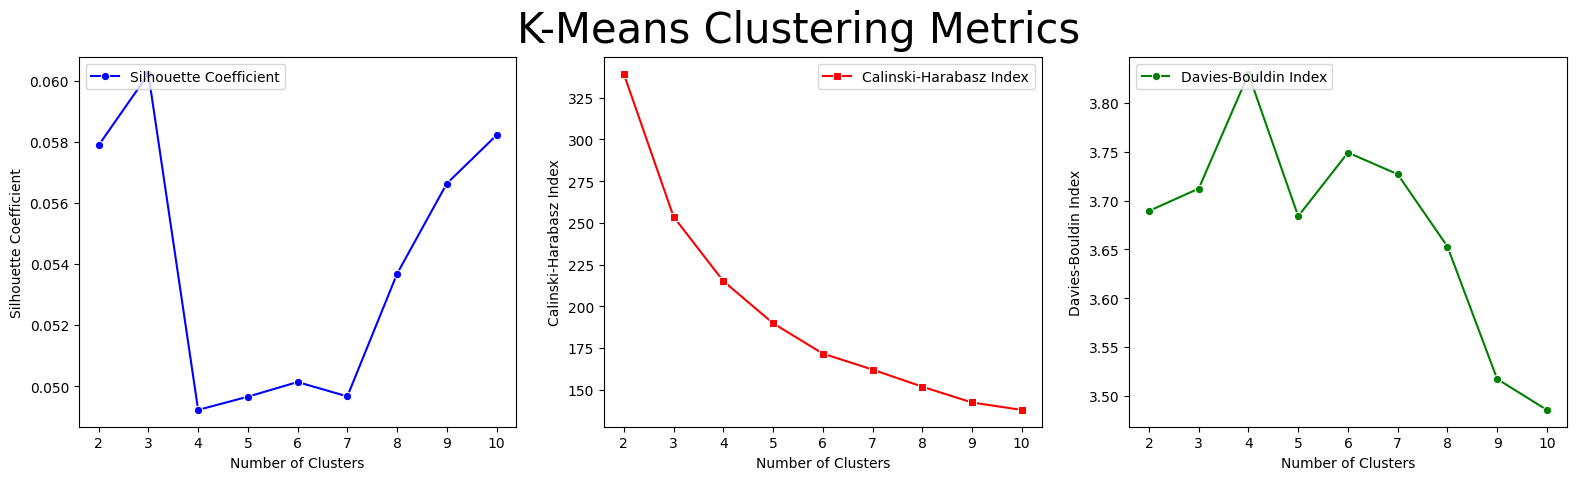
A grid search was performed on the k-Means clustering algorithm to identify the optimal number of clusters, with a range of possible values for k evaluated using internal validation metrics such as the Silhouette Score, Davies-Bouldin index, and Calinski-Harabasz index. Through this systematic evaluation, the optimal balance between cluster separation and coherence was identified, resulting in the optimal number of clusters for the k-Means algorithm being determined as K = 2.
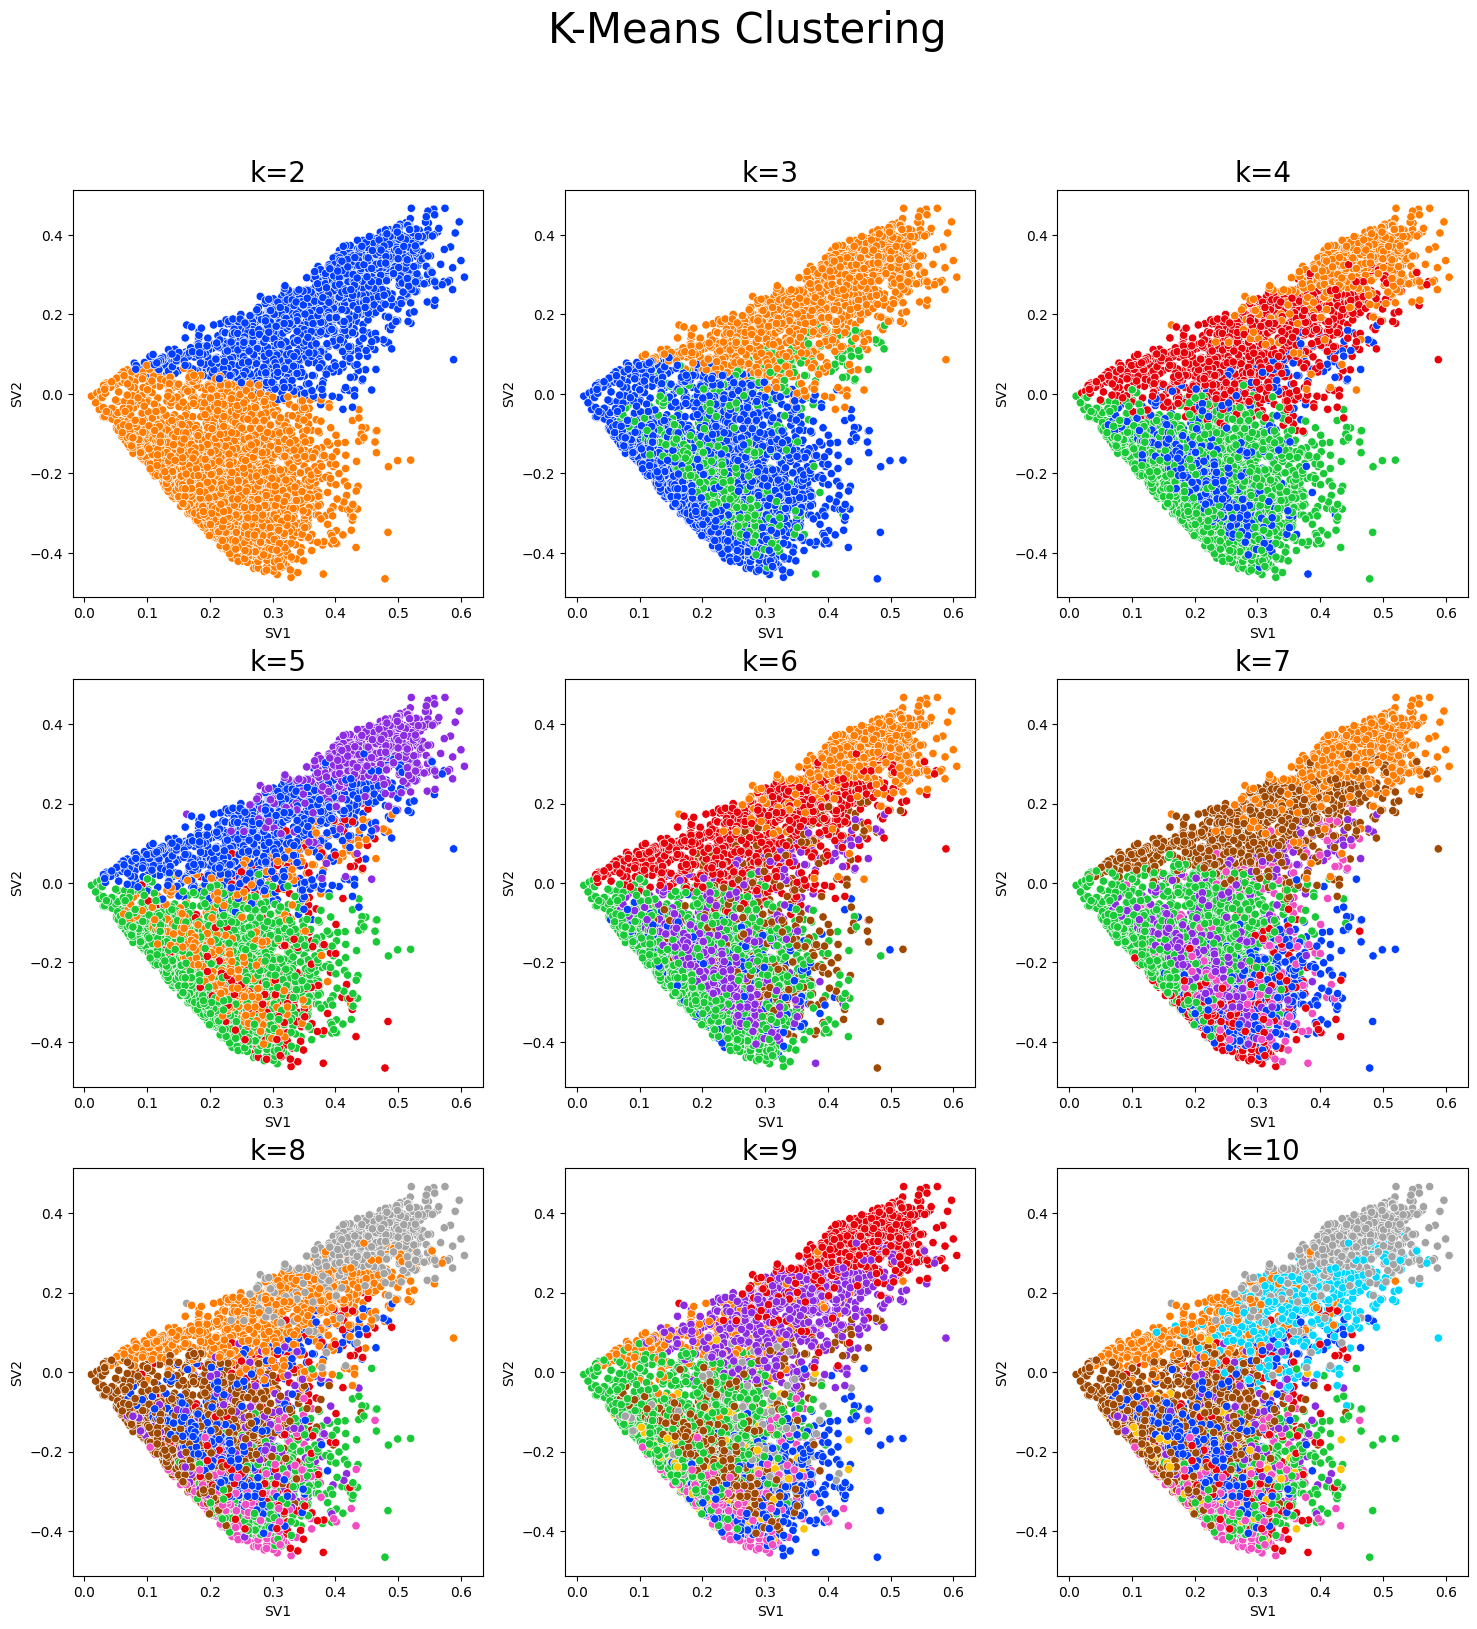
dmw2_final.run_kmeans(dmw2_final.final_tsvd, df_corpus, dmw2_final.feature_names)
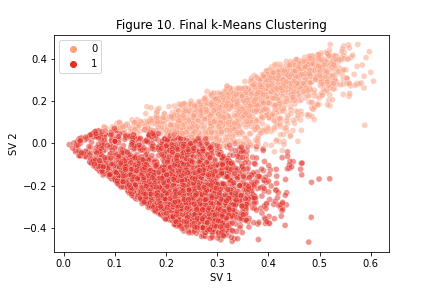
The k-Means clustering resulted in two optimal clusters, providing valuable insights into the structure of the dataset and simplifying the representation of the data points.
Single, Complete, Average, and Ward
dmw2_final.plot_dendrograms(dmw2_final.final_tsvd)
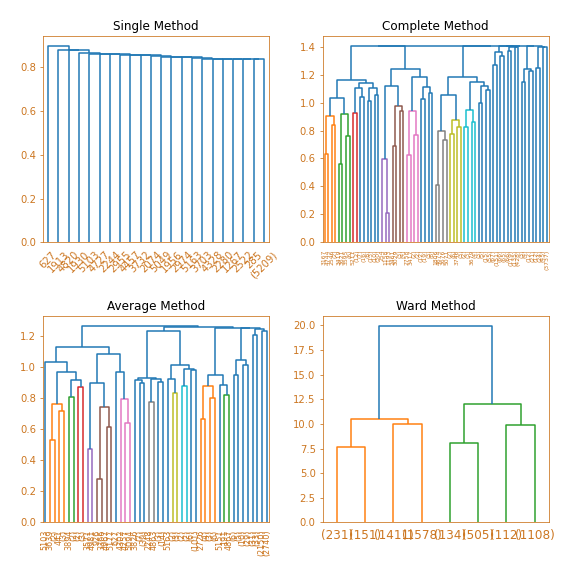
This visualization helps us gain a better understanding of the clustering process by displaying the unique outcomes generated by four different linkage methods: single, complete, average, and Ward. Given that Ward linkage may produce similar clustering results as k-Means but can be computationally expensive, it may be more reasonable to choose k-Means clustering.
WORDCLOUD
dmw2_final.create_word_clouds(df_food, dmw2_final.cluster_indexes)
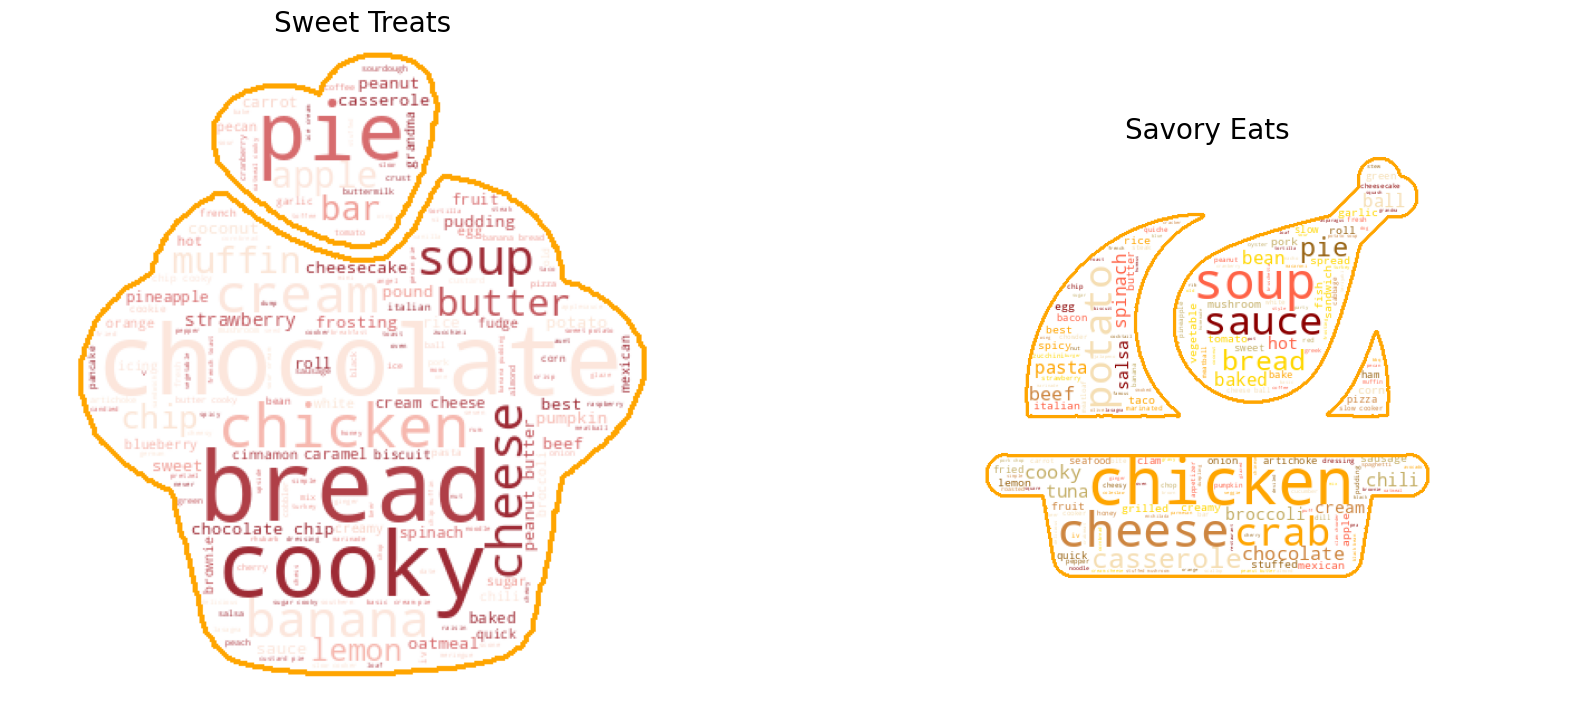
We utilized k-Means clustering with two clusters to generate two word clouds based on the frequency of terms in each cluster, labeling them as “Sweet Treats” and “Savory Eats”. The resulting word clouds provided a concise visual summary of the main themes and topics associated with each category, enabling us to easily identify the most relevant recipes for each group. By using this approach, we were able to gain valuable insights into the underlying structure of the input data and facilitate more efficient recipe recommendations or menu planning.
RECOMMENDER SYSTEM

Collaborative Filtering
In this section of the analysis, two separate recommendation systems: one for Sweet Treats and the other for Savory Eats were built. We used a collaborative filtering approach based on user-item interactions to make personalized recommendations. Specifically, we will be implemented a nearest-neighbor collaborative filtering algorithm to predict user ratings for recipes based on their past ratings and the ratings of similar users. This approach showed effectiveness in generating accurate and personalized recommendations for users.
Cluster 1: Sweet Treats
dmw2_final.food_recommendation1(df_food, df_ratings, 'Creamy Caramel Flan Recipe')
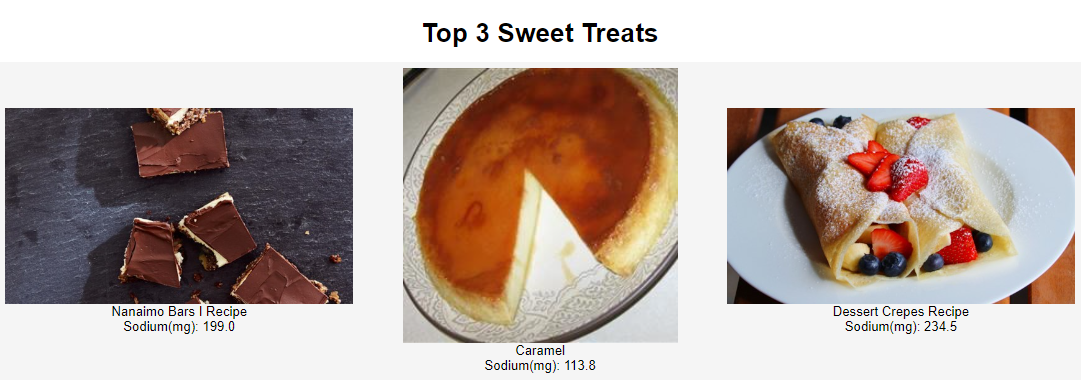
The Sweet Treats recommendation system has generated a list of three top recommendations based on the input “Creamy Caramel Flan Recipe”.
It not only provides the names of the recommended desserts but also displays their sodium content. This information can be useful for users who are conscious about their sodium intake and would like to avoid hypertension. By presenting this additional information, the system enables users to make informed decisions about which dessert to choose, based on their dietary requirements and preferences. This feature highlights the system’s commitment to providing personalized and relevant recommendations that take into account the individual user’s needs and preferences.
Cluster 2: Savory Eats
dmw2_final.food_recommendation2(df_food, df_ratings, 'Homemade Mac and Cheese Recipe')
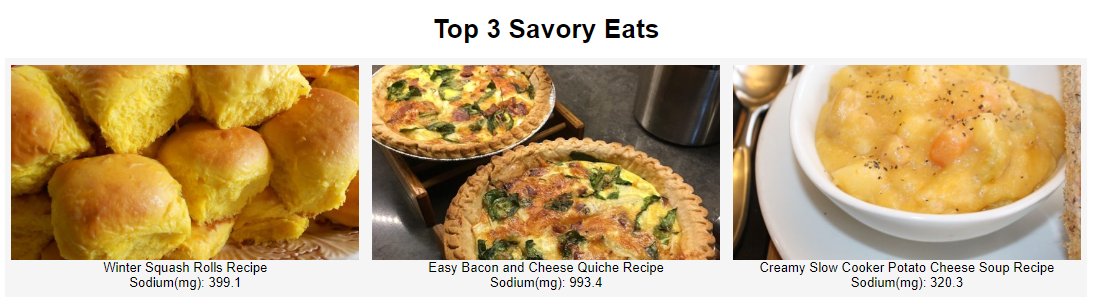
The Savory Eats recommendation system has generated a list of three top recommendations based on the input “Homemade Mac and Cheese Recipe”.
It not only provides the names of the recommended desserts but also displays their sodium content. This information can be useful for users who are conscious about their sodium intake and would like to avoid hypertension. By presenting this additional information, the system enables users to make informed decisions about which dessert to choose, based on their dietary requirements and preferences. This feature highlights the system’s commitment to providing personalized and relevant recommendations that take into account the individual user’s needs and preferences.
CONCLUSION
The team used k-Means clustering to explore the structure of the recipe dataset and discovered two main clusters: Sweet Treats and Savory Eats. This information can be useful for identifying popular flavor profiles and for tailoring recipe recommendations based on individual preferences. Moreover, by leveraging Neighborhood-Based Collaborative Filtering and capturing nutritional thresholds for hypertensive individuals, our recommendation system was able to provide recipe suggestions that are both delicious and healthy. This has the potential to help hypertensive patients adhere to dietary restrictions and improve their overall health outcomes.
__Overall, our study highlights the potential of data-driven approaches to promote healthier eating habits, especially for those with specific health concerns such as hypertension.__ By leveraging machine learning techniques and nutritional expertise, we can create personalized recommendations that are both enjoyable and beneficial for individuals’ health.
RECOMMENDATIONS
The team is confident in the potential of our recommendation system, and we have identified several key areas for improvement and expansion. These include:
- User Value:
To enhance the customization of our recommendation system, we plan to capture more customized nutritional thresholds beyond the current 2,000 mg sodium daily restriction for hypertensive individuals. While this restriction is recommended by the World Health Organization, there may be individuals whose doctors have prescribed different thresholds based on their specific health needs. By capturing more personalized nutritional thresholds, our system can provide more tailored recipe recommendations to meet the diverse dietary needs of individuals with hypertension. Therefore, the team aims to improve the existing system by incorporating additional customized nutritional thresholds to accommodate a wider range of scenarios. This would further enhance the personalization of our recommendation system and provide more accurate and relevant recipe recommendations to our users.
To extend the explainability of the recommended recipes to eaters, we plan to leverage the power of Explainable Artificial Intelligence (XAI) techniques. XAI is a growing field that focuses on developing transparent and interpretable machine learning models that can provide insights into how a model arrived at a particular decision or recommendation. By leveraging XAI techniques, we can provide users with clear and transparent explanations of how our recommendation system arrived at a particular recommendation. This can improve user trust and engagement, leading to greater adherence to dietary restrictions and ultimately improving the health outcomes of individuals with hypertension.
- Business Value:
To expand our recommendation system to include other health conditions such as cancer, gout, and others so as to significantly improve the health outcomes of individuals with these conditions. By leveraging the same data extraction, cleaning, processing, text vectorization and clustering, and recommendation system methodologies used for hypertensive patients, we can tailor our system to capture the nutritional thresholds and dietary restrictions specific to these health conditions. This can enable individuals with these conditions to find recipes that fit their dietary requirements and improve their overall health outcomes. Furthermore, expanding to other health conditions can also potentially increase the user base and reach of our recommendation system, leading to greater impact and success.
To maximize the impact and reach of our recommendation system, we plan to explore partnerships with food delivery services. This partnership will allow us to integrate our recommendation system with their platforms, reaching a wider audience of potential users. Additionally, partnering with food delivery services could potentially provide a new revenue stream. Moreover, by collaborating with these services, we can gain access to vast amounts of consumer purchase behavior data, which can help us improve the performance of our algorithm. With this data, we can fine-tune our recommendation system to better align with user preferences and dietary needs, ultimately leading to improved health outcomes for individuals with hypertension and other health conditions.
REFERENCES
[1] Hypertension. (2021, August 25). World Health Organization. https://www.who.int/news-room/fact-sheets/detail/hypertension.
[2] allrecipes.com website. https://www.allrecipes.com.
[3] World Heart Federation. https://world-heart-federation.org.
[4] Baker’s Clay. (2022, July 22). Johanna. https://www.allrecipes.com/recipe/11125/bakers-clay/
[5] 11 Dimensionality reduction techniques you should know in 2021. (2021, Apr 14). Rukshan Pramoditha. https://towardsdatascience.com/11-dimensionality-reduction-techniques-you-should-know-in-2021-dcb9500d388b
ACKNOWLEDGEMENT
I completed this project with my Learning Team, which consisted of Frances Divina Egango, Jed Alvin Guinto, Jose Ramon Jimenez, and Bernadette Obiso.