
Artificial K-Intelligence
Published:
EXECUTIVE SUMMARY
The Korean drama (KDrama) industry has witnessed a remarkable rise in global popularity, captivating audiences with its unique blend of elements. Despite this success, the industry faces significant challenges due to increasing production costs. Striking a balance between creative expression and financial constraints has become a priority for producers seeking innovative ways to create high-quality series that resonate with viewers.
By leveraging machine learning models and the SHapley Additive exPlanations (SHAP) method, producers can better navigate these challenges and develop high-quality series that appeal to their target audience.
An analysis of the TMDB KDramas 2022 dataset using AI has revealed intriguing insights into the factors influencing KDrama series’ popularity. Certain themes and narratives appear to resonate more with viewers, while others garner less interest. Series based on novels or comics, exploring horror themes, or focusing on boss/employee relationships have higher appeal compared to love triangles, mini-series, and suspense-driven plots. Additionally, historical themes may negatively impact the popularity of high budget, low rating series.
These findings hold significant implications for production companies, as the selection of themes and narratives can substantially impact a KDrama series’ popularity. By concentrating on elements that strongly resonate with viewers, companies can improve their chances of producing hit series with high ratings and broad appeal.
In summary, this project underscores the potential of AI and data analysis in uncovering insights into audience preferences and the factors contributing to the success of KDrama series. As the industry continues to grow and evolve, these insights will prove invaluable for producers and creators aiming to develop high-quality, engaging series that captivate viewers worldwide.
TABLE OF CONTENTS
INTRODUCTION
Motivation
The modern entertainment industry has long grappled with the challenge of balancing creative expression and financial constraints. As this industry grow increasingly supported yet competitive, producers have been searching for innovative solutions to produce high-quality series that resonate with audiences.
In particular, the Korean drama (KDrama) industry has experienced a surge in popularity in recent years, with viewers around the world captivated by its unique combination of elements.
The allure of KDramas is multifaceted, as each element serves to create a deeply immersive and captivating viewing experience for audiences. The production value of KDramas is particularly notable, with producers investing significant resources to ensure that every detail is executed flawlessly. They have a layered storytelling and top-tier acting performances that enable viewers to connect with the characters and become fully invested in the storylines.
Moreover, their constantly evolving narrative structure of KDramas keeps viewers engaged and excited, as they never quite know what to expect. It may also be due to their catchy original soundtracks which are being featured in KDramas that add an extra layer of depth and emotion to the viewing experience, drawing viewers even further into the world of the series.
However, the KDrama industry has been facing significant challenges in recent years the cost of producing KDrama episodes has risen to seven hundred million won (₩ 700M) by the year 2021. [1]
By uncovering the critical factors that determine the success of KDrama series and providing actionable insights for producers, they could make their mark in this highly competitive industry. And as a result, this may also inspire a new wave of innovation and creativity in the KDrama industry, empowering producers to bring captivating stories to life while staying true to their vision and budget.
Problem Statement
With the use of artificial intelligence (AI), producers could decipher the complex world of KDrama production by can gaining insights into how to balance creative and financial pressures while still producing high-quality series that can appeal to audiences through the use of SHapley Additive exPlanations (SHAP) method.
Limitations
Many producers do not disclose the production cost information, making it difficult to obtain a comprehensive understanding of the financial pressures facing the industry. As a result, the team computes the production cost for this study by binning the popularity of the cast members into 3 categories (i.e. Newbie, Experienced, Popular) and converting it into salaries, which were then multiplied by the number of episodes.
While this approach allowed us to estimate the production costs of KDramas with a reasonable degree of accuracy, it is important to note that it may not fully capture the nuances of the production process. Moreover, there may be other factors that impact the cost of producing a KDrama that we were unable to account for in our analysis.
Another potential limitation of this study is the focus on high-budget, low-rating and low-budget, high-rating KDramas. While this approach allowed us to identify critical factors that contribute to the success of KDramas, it may not fully capture the complexity of the industry or the diversity of KDrama series. As such, further research is needed to explore the factors that contribute to the success of KDramas across a broader range of categories and budgets.
While our study offers valuable insights into the challenges and opportunities facing the KDrama industry, it is important to approach our findings with a degree of caution and to recognize the limitations inherent in our methodology.
METHODOLOGY
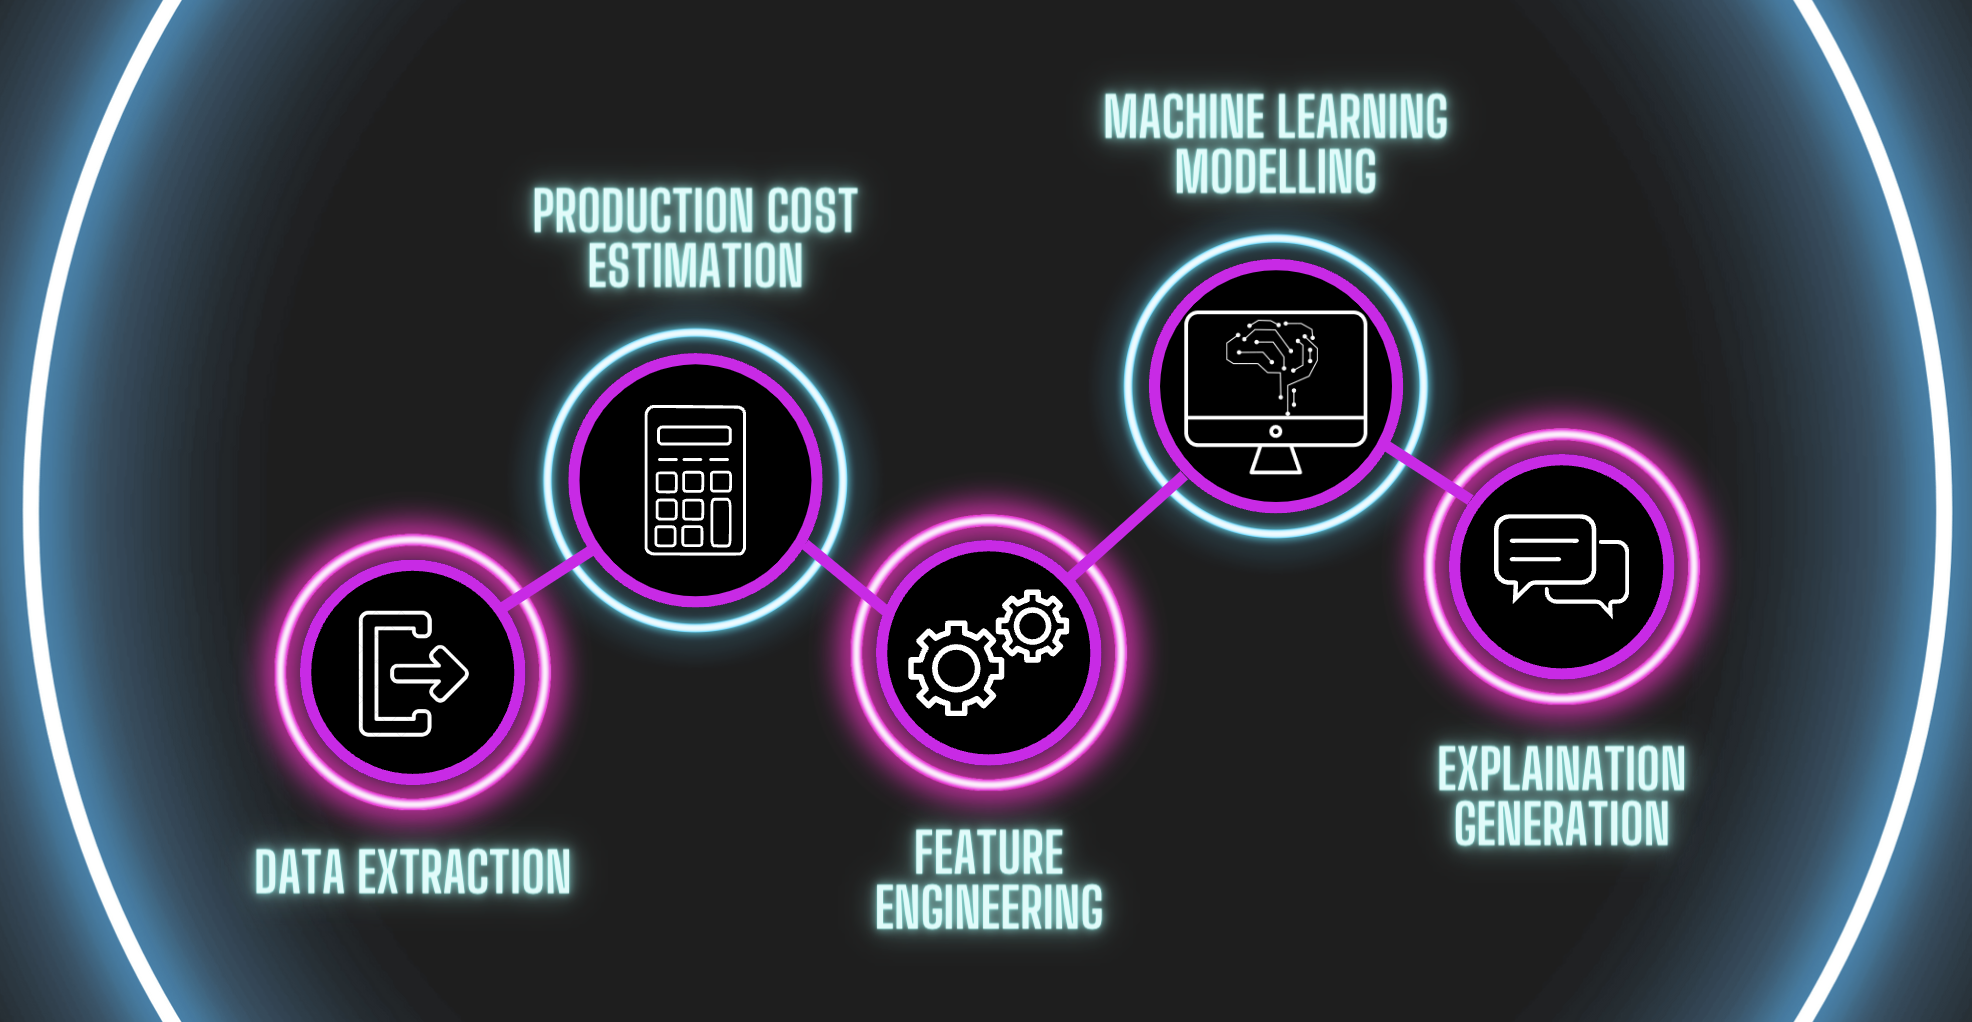
Data Extraction
The data, TMDB KDramas 2022 dataset was taken from Kaggle and was accessed through https://www.kaggle.com/datasets/robertonacu/tmdb-kdramas-2022.
Production Cost Estimation
The cost of production for each cast member will be estimated based on their popularity and the salary range associated with their respective bin. These values will then be multiplied by the number of episodes in the series to estimate the total production cost for cast salaries.
Feature Engineering
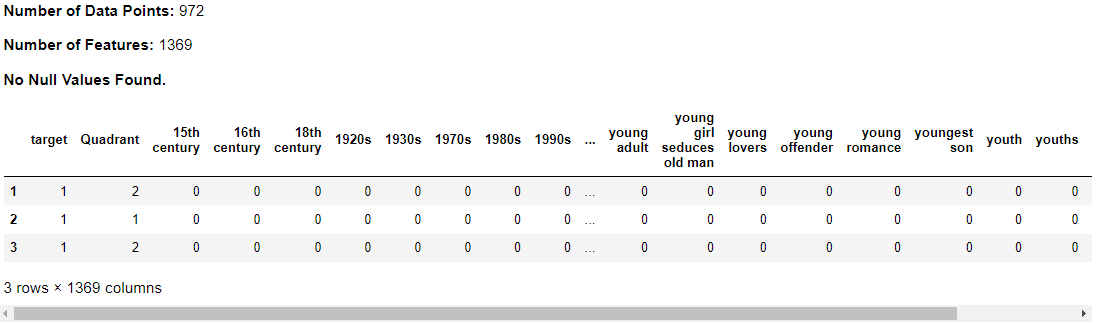
To determine the most important features of each series, Lasso or L1 Regression was used. This step reduced the number of columns from 1,369 to 100.
Lasso Regresion or L1 Regularization was performed in order to get and retain only the most important feature for each quadrant. By doing this step, it reduces the model complexity and at the same time removes the possibility of multicollinearity on the remaining features. What Lasso does is that it adds a penalty term which is the absolute value of magnitude of coefficient to the loss function (based on the hypertuned parameter of alpha on these cases) or to laymanize, it is a technique that shrinks the less important feature’s coefficient to zero, thus useful for feature selection.
Machine Learning Modelling
To predict the popularity of a series, two machine learning models were used: Random Forest Classifier and used the F-1 score as its metric.
Explanation Generation
Interpretations of the output of the machine learning model were defined through the use of SHapley Additive exPlanations (SHAP).
DATA HANDLING
Library Importation
# helper utility function
import kdu

import numpy as np
import pandas as pd
import matplotlib.pyplot as plt
import seaborn as sns

import re, time, os, joblib
from tqdm.notebook import trange, tqdm
from nltk.corpus import stopwords
from nltk.stem.snowball import SnowballStemmer
from nltk.stem import PorterStemmer, WordNetLemmatizer

from tqdm.notebook import tqdm, trange
from wordcloud import WordCloud, STOPWORDS, ImageColorGenerator
from PIL import Image as WordImage
from IPython.display import Image
from IPython.display import display, display_html, HTML
from plotnine import *
from sklearn.model_selection import cross_val_score
from sklearn.metrics import mean_squared_error
from sklearn.linear_model import Lasso


from scipy.sparse import csr_matrix
from sklearn.decomposition import TruncatedSVD
from sklearn.feature_extraction.text import TfidfVectorizer
from sklearn.exceptions import ConvergenceWarning
from sklearn.neighbors import NearestNeighbors
from sklearn.cluster import (KMeans, AgglomerativeClustering, DBSCAN, OPTICS,
                             cluster_optics_dbscan)
from sklearn.metrics import (silhouette_score, calinski_harabasz_score,
                             davies_bouldin_score)

# ML
from imblearn.pipeline import Pipeline
from sklearn.model_selection import GridSearchCV, KFold
from sklearn.preprocessing import StandardScaler, MinMaxScaler, RobustScaler
from sklearn.preprocessing import OneHotEncoder, OrdinalEncoder, LabelEncoder
from sklearn.compose import ColumnTransformer
from sklearn.model_selection import train_test_split

# Regression Models
from sklearn.neighbors import KNeighborsRegressor
from sklearn.linear_model import Ridge
from sklearn.ensemble import RandomForestRegressor
from sklearn.ensemble import GradientBoostingRegressor
from lightgbm import LGBMRegressor
from xgboost import XGBClassifier

# Classifier Models
from sklearn.neighbors import KNeighborsClassifier
from sklearn.linear_model import LogisticRegression
from sklearn.ensemble import RandomForestClassifier
from sklearn.ensemble import GradientBoostingClassifier
from lightgbm import LGBMClassifier
from catboost import CatBoostClassifier
import pandas as pd
from sklearn.metrics import (precision_score, recall_score,
                             accuracy_score, f1_score)
from sklearn.tree import DecisionTreeClassifier
from sklearn.ensemble import RandomForestClassifier
from sklearn.ensemble import GradientBoostingClassifier
from sklearn.pipeline import Pipeline
from sklearn.preprocessing import RobustScaler
from sklearn.model_selection import GridSearchCV

# Explainability
import shap
from dice_ml import Data, Model, Dice

import warnings
warnings.filterwarnings('ignore')
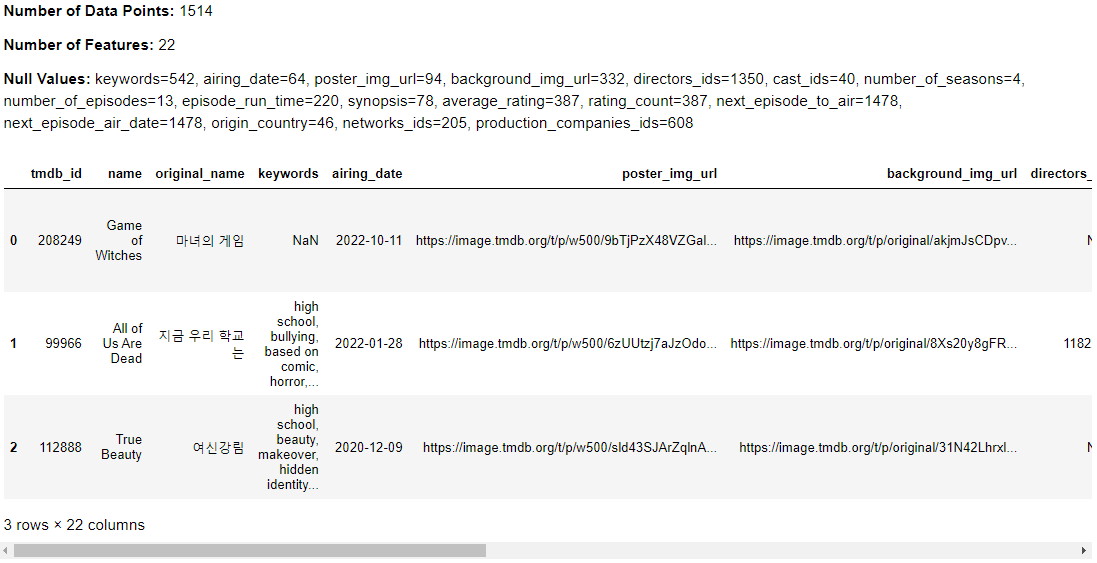
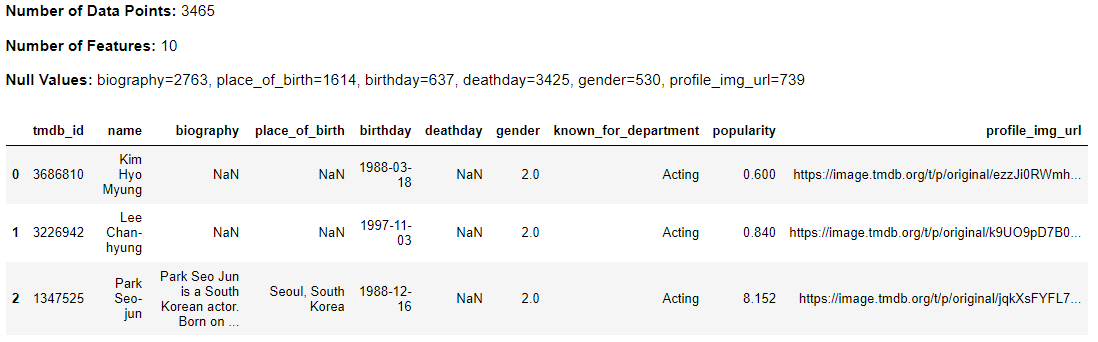
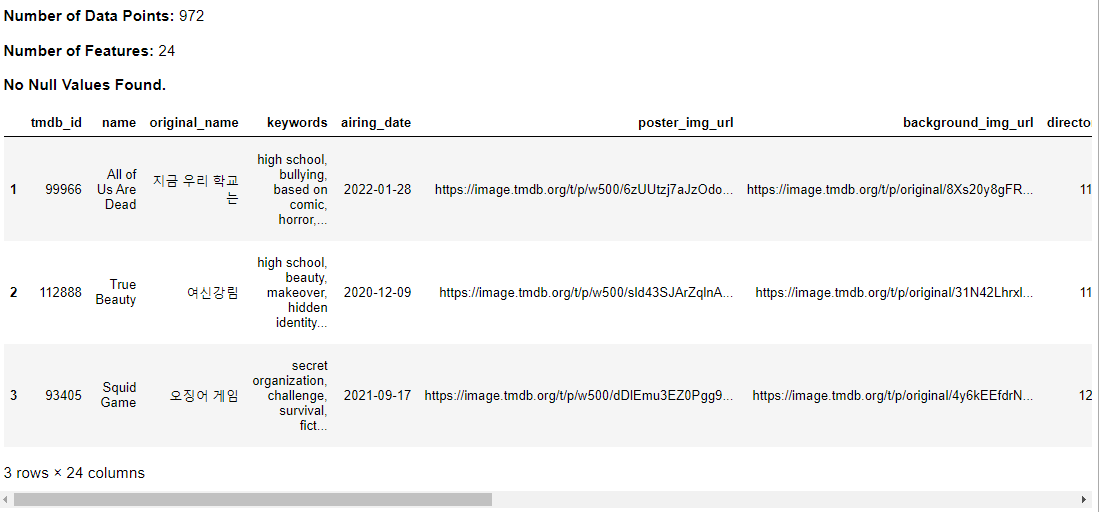
Data Source and Description
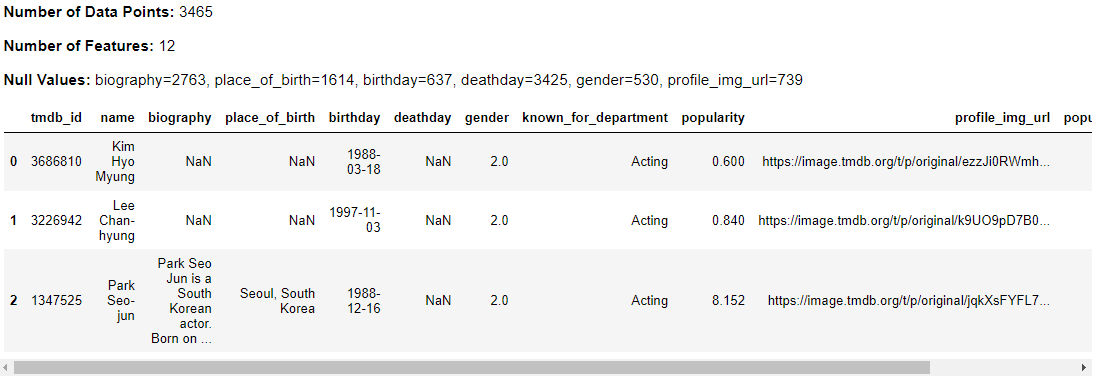
The data source for this study is the TMDB KDramas 2022 dataset, which is available on Kaggle. This dataset includes information on Korean drama (KDrama) series from 1985 to 2022, as well as details on the cast, crew, and production companies involved in each series.
The dataset contains multiple files, including series.csv, which provides information on each KDrama series, such as its title, release year, rating, popularity, and budget. Cast.csv provides information on the actors and actresses who starred in each series, while production.csv provides information on the directors, writers, and other production crew members. Networks.csv lists the production companies involved in each series, while genres.csv provides information on the genre(s) of each series.
Data Loading
series_data, people_data = kdu.load_data()
kdu.df_exploration(series_data)
kdu.df_exploration(people_data)
Data Processing
Popularity Binning and Salary Conversion
To calculate the production cost for cast salaries, the data was first divided into bins based on the popularity of the cast, with each bin corresponding to a particular salary range. This approach enabled us to estimate the cost of production for each cast member based on their popularity and the salary range associated with their respective bin.
kdu.df_exploration(kdu.create_popularity_bins(people_data))
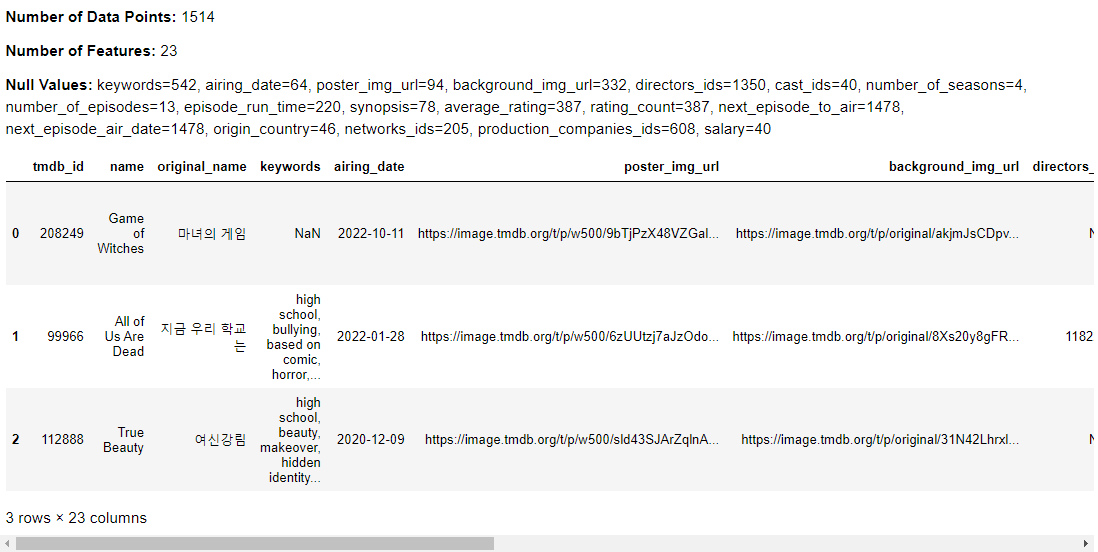
kdu.translate_ids_to_salaries(series_data, 'cast_ids', people_data, 'salary')
kdu.df_exploration(series_data)
Production Cost Computation
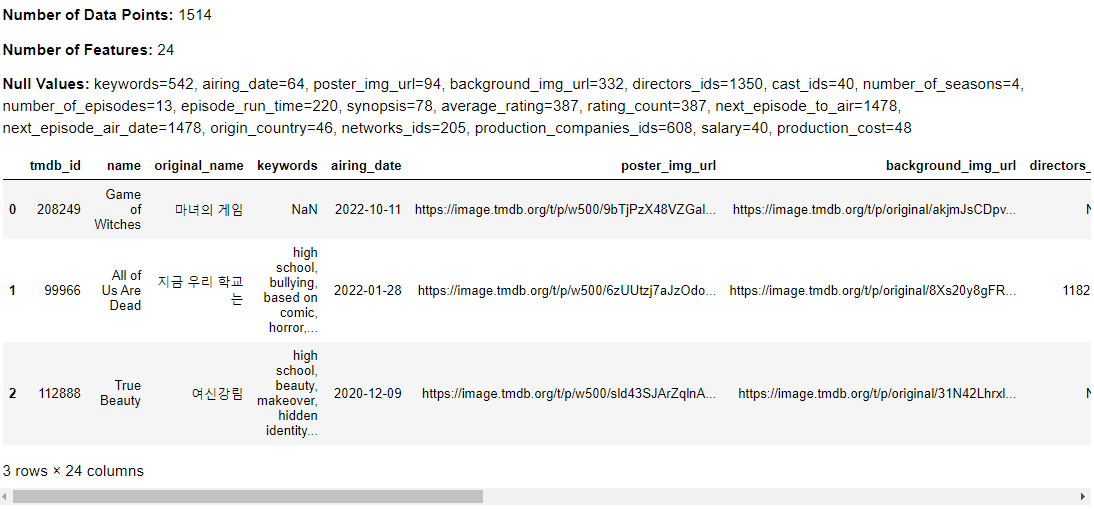
Once the salary of each cast member was determined using the binning approach, the next step involved multiplying this value by the number of episodes in the series to estimate the total production cost for cast salaries.
kdu.df_exploration(kdu.add_production_cost(series_data))
Popularity Classification
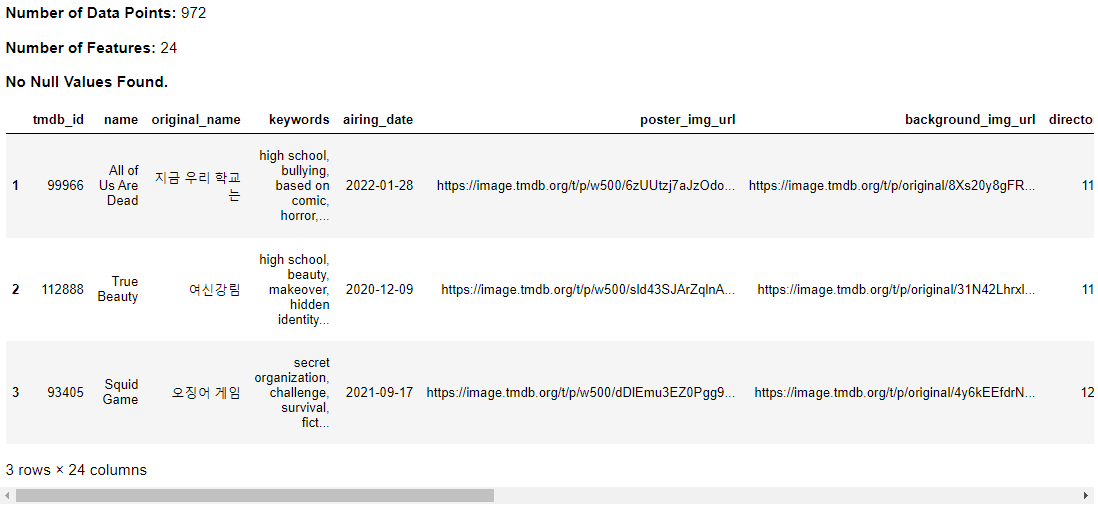
The process of assigning a classification to the target variable involved determining whether a KDrama series was popular or not. Specifically, any series with an average rating above 7.7 was deemed to be popular.
df_cleaned = kdu.preprocess_series_data(series_data)
kdu.df_exploration(df_cleaned)
Data Exploration
kdu.df_exploration(df_cleaned)
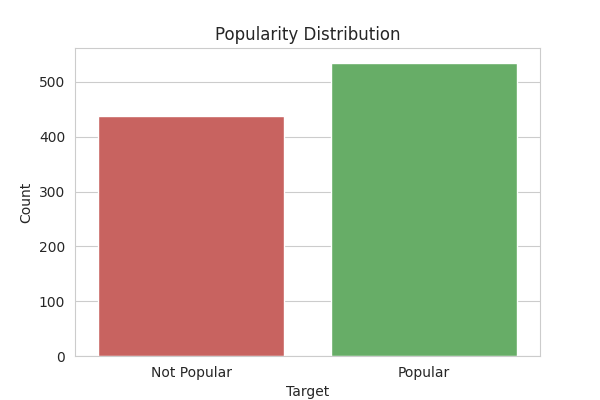
Proportional Chance Criterion (PCC)
Upon completion of the classification process, KDrama series with an average rating of greater than 7.7 were categorized as popular, resulting in a total of 437 popular series within our dataset. Conversely, a total of 535 series were classified as not popular, reflecting a balanced distribution of targets. Our assessment of the proportional chance criterion (PCC) yielded a score of 0.505, indicating that data points could be correctly labeled with a probability of 50.5%.
kdu.visualize_target_distribution(df_cleaned)
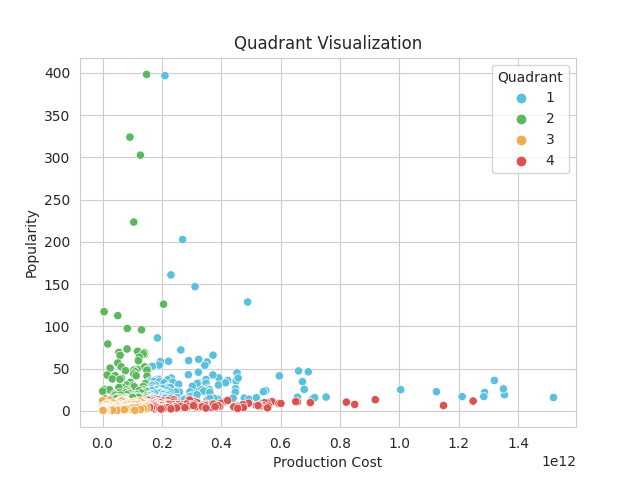
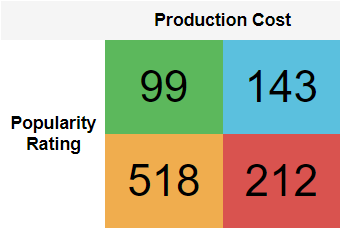
Matrix Creation
Determining the relationship of the target (popularity) and the budget of the production company is one of the key steps in this project. It was achieved by plotting the datapoints in a scatterplot and divided into four quadrants namely:
a. High Budget + High Rating;
b. Low Budget + High Rating;
c. Low Budget + Low Rating; and
d. High Budget + Low Rating.
We believe that there are certain factors that would prove beneficial and some might prove detrimental for each set-up.
df_quad = kdu.assign_quadrant(df_cleaned)
kdu.plot_quadrant_visualization(df_quad)
One-Hot Encoding
This step converts the all of the keywords mentioned in the dataset as each of its column through one-hot encoding. This will determine which drama concepts should the production company use or avoid.
df_final = kdu.preprocess_keywords_data(df_cleaned)
Feature Engineering
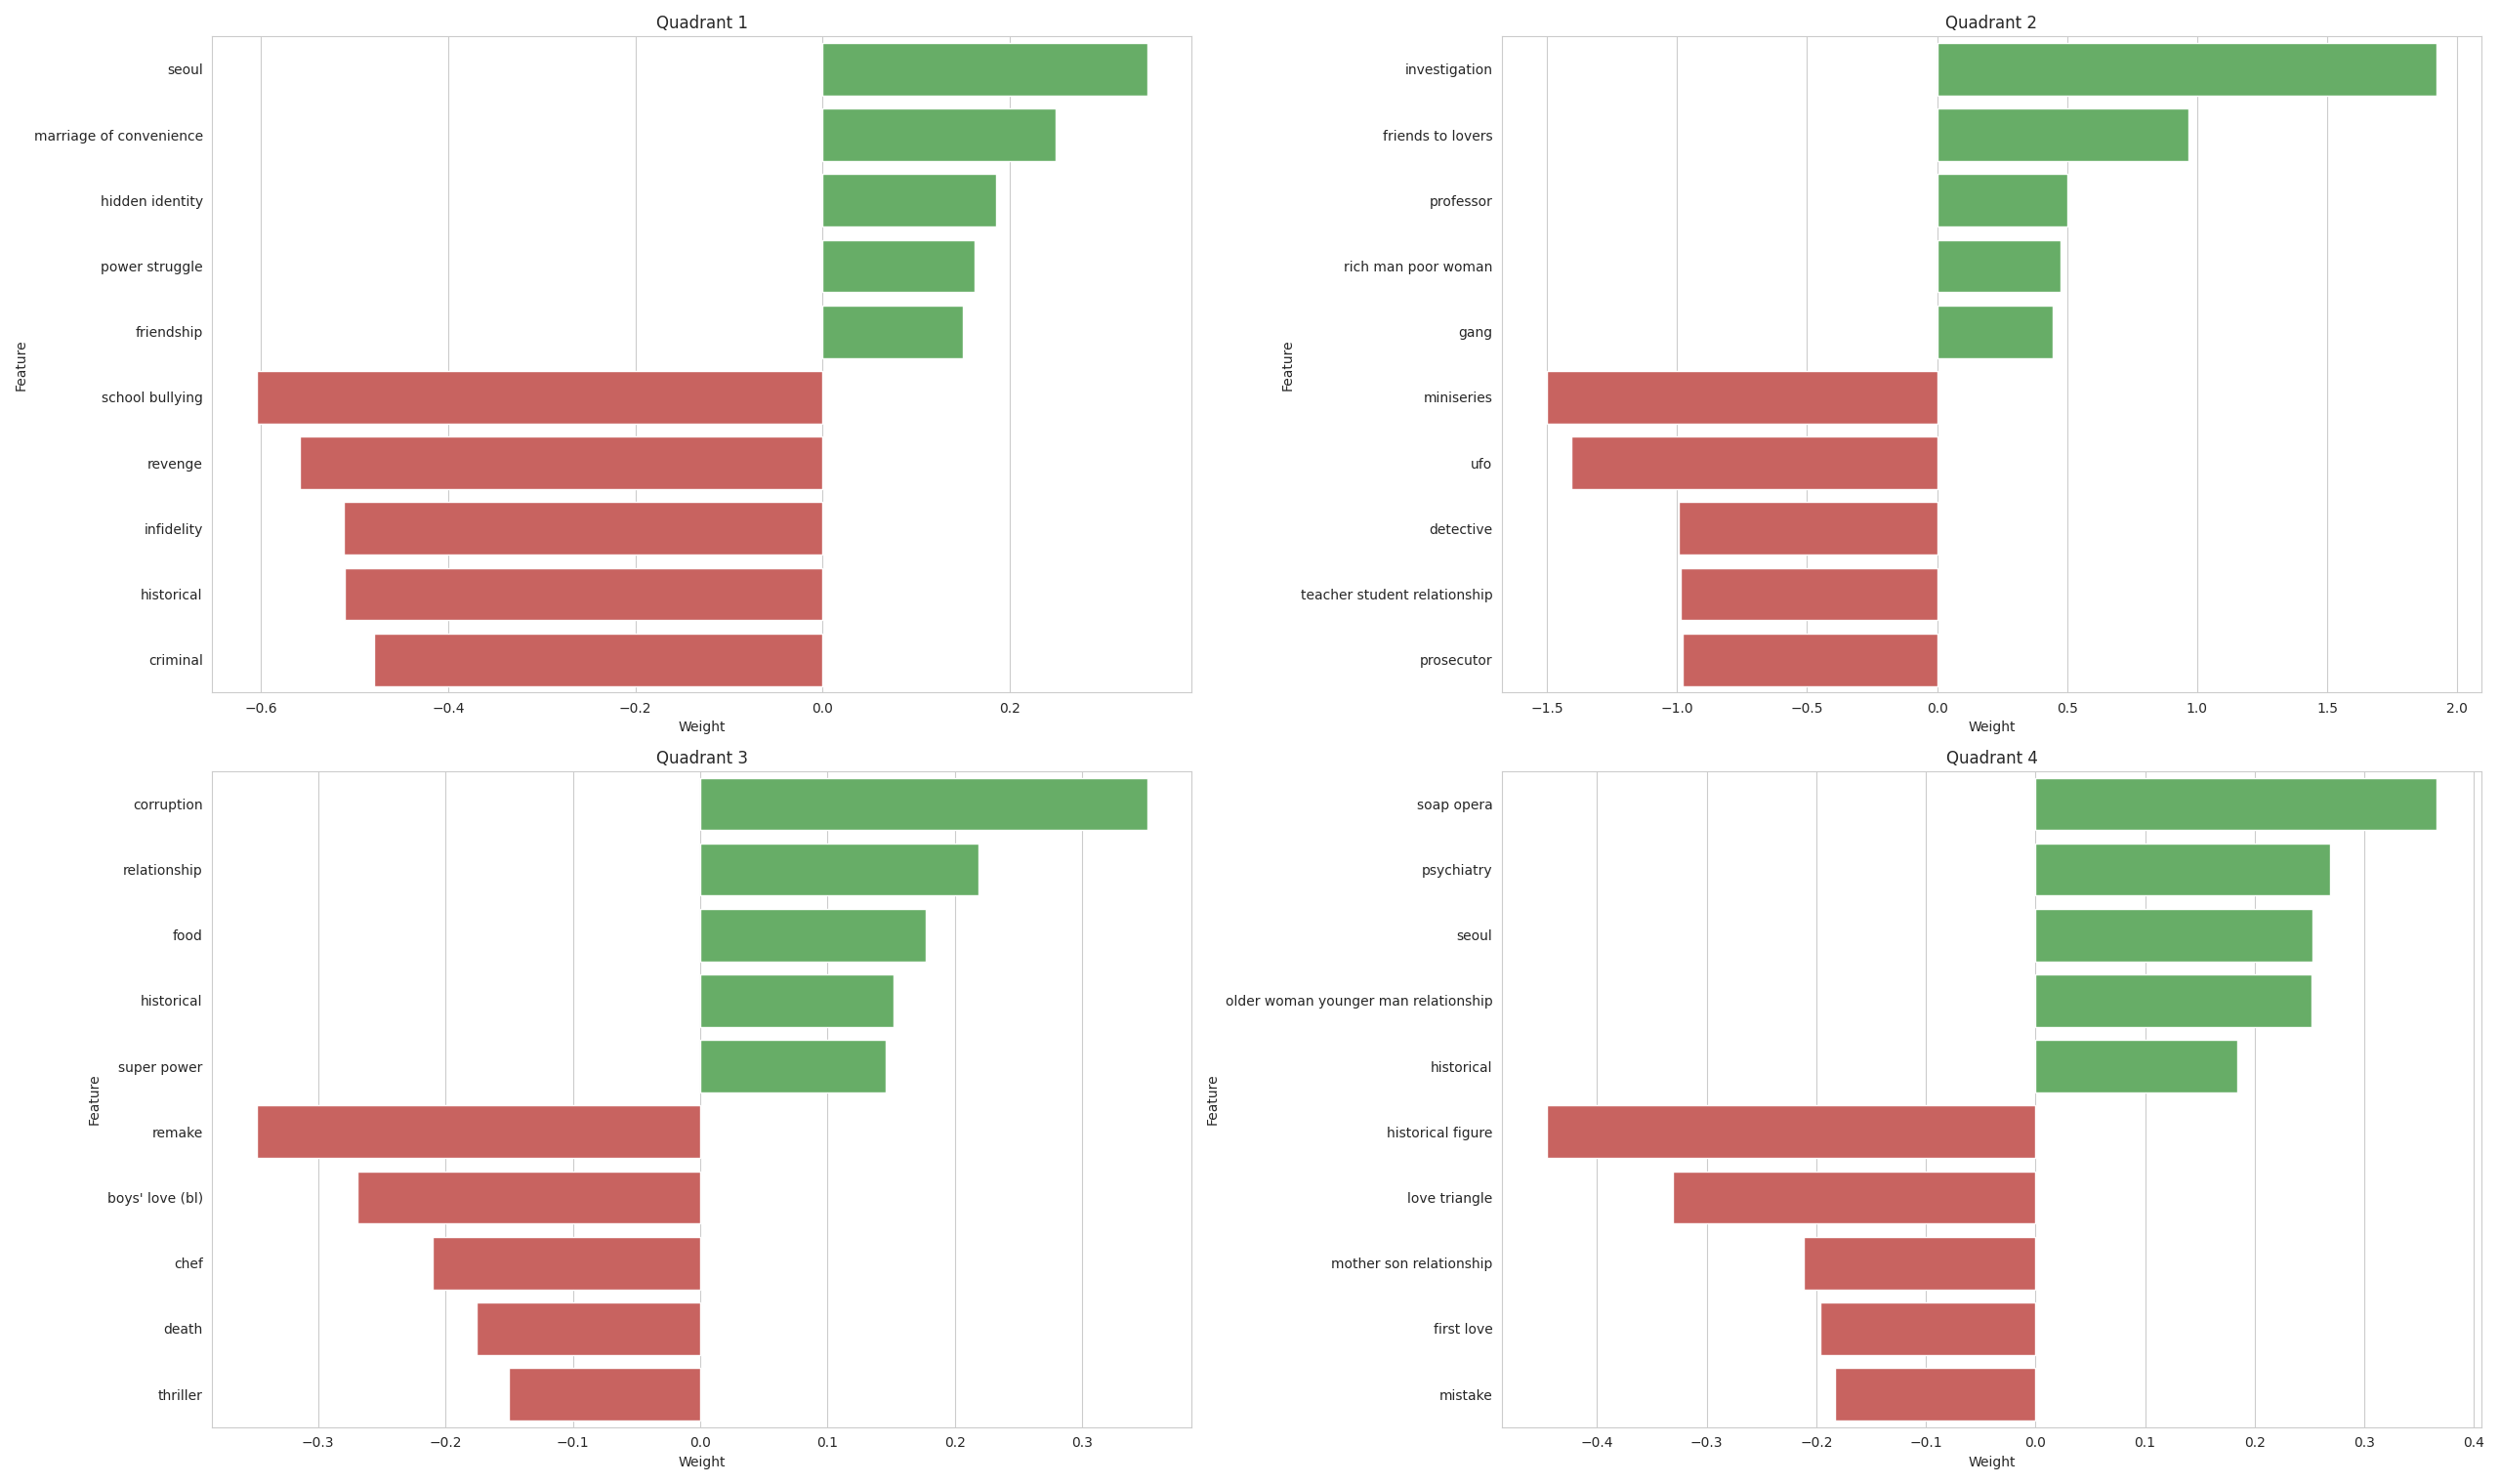
Lasso or L1 Regression was used in order to get the most important feature for each quadrant and are displayed in the bar graph below. The regression was able to reduce the variables from 1,369 down to 100.
For Quadrant 1, the top topics like seoul, marriage of convenience, and hidden identity, among others show positive weights. On the other hand, topics like school bullying, revenge, and infidelity are shown to have negative weights. This means that the production company, if they wish to produce a hit series should build a story around a marriage of convenience and/or hidden identity in the City of Seoul; while avoiding plots like infidelity, revenge, and school bullying.
For Quadrant 2 which contains the low budget, high rating series, featured topics such as investigation and friends to lovers proved to be a hit for the audiences. However concepts like ufo and miniseries were not so much patronized.
Moving on to the next quadrant, remakes should be the avoided by the production companies if they have low budget in order to steer clear of the low ratings for their future projects.
Although production companies want to go all out for certain projects, they should try to avoid contents that feature historical figure and love triangle which are shown by our model to garner low ratings.
quadrant_splits = kdu.prepare_quadrant_splits(df_final)
lasso_models = kdu.fit_lasso_and_plot(
    quadrant_splits, kdu.custom_scorer, top_n=5)
RESULTS AND DISCUSSION
Train-test split with reduced features
quadrant_reduced = kdu.get_quadrant_reduced(df_final, lasso_models)
Runnning the ML pipeline
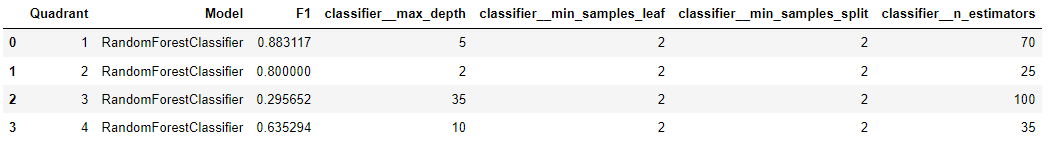
Random Forest is a collection of decision trees, with each tree is comprised of data sampled from the training set with replacement. Random Forest Classifier was used due to the nature of the project being a classification problem. Intuitively, this algorithm classifies and subdivides the datapoints accordingly.
Apart from the fact that the F1 score is a metric commonly used in machine learning to evaluate the performance of binary classification models, it balances and takes into account both precious and recall. In the context of predicting whether a series will be popular or not, recall would measure the proportion of correctly identified popular series among all actual popular series or the true positive rate. On the other hand, precision would measure the proportion of correctly identified popular series among all predicted popular series.
# Define the classifiers
forest_clf = RandomForestClassifier(
    random_state=10053, n_jobs=-1,  criterion='entropy')

# Define the parameter grids
forest_params = {
    'classifier__n_estimators': [25, 35, 50, 60, 70, 100, 125, 150],
    'classifier__max_depth': [2, 3, 5, 10, 15, 20, 35, 50],
    'classifier__min_samples_split': [2, 5, 10],
    'classifier__min_samples_leaf': [2, 4, 8],
    'classifier': [forest_clf]
}

scoring = ['f1']

results_df = kdu.fit_classifiers(
    quadrant_reduced, forest_clf, forest_params, scoring)
results_df
Determining the best model
best_models_and_shap = (
    kdu.get_best_models_and_shap(quadrant_reduced, results_df))
Quadrant 1 - High Budget, High Rating
shap.summary_plot(best_models_and_shap[1]
                  ['shap_explanation'], plot_size=(5, 5))
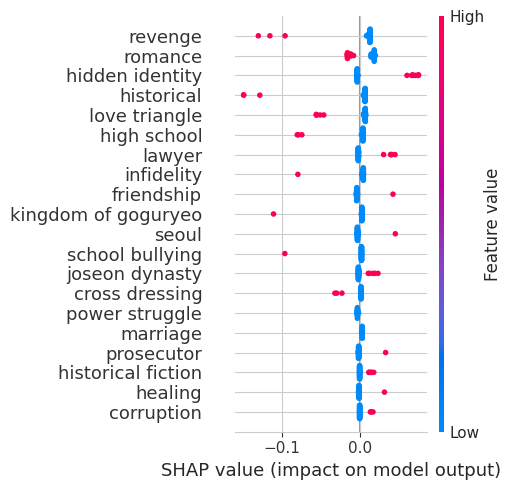
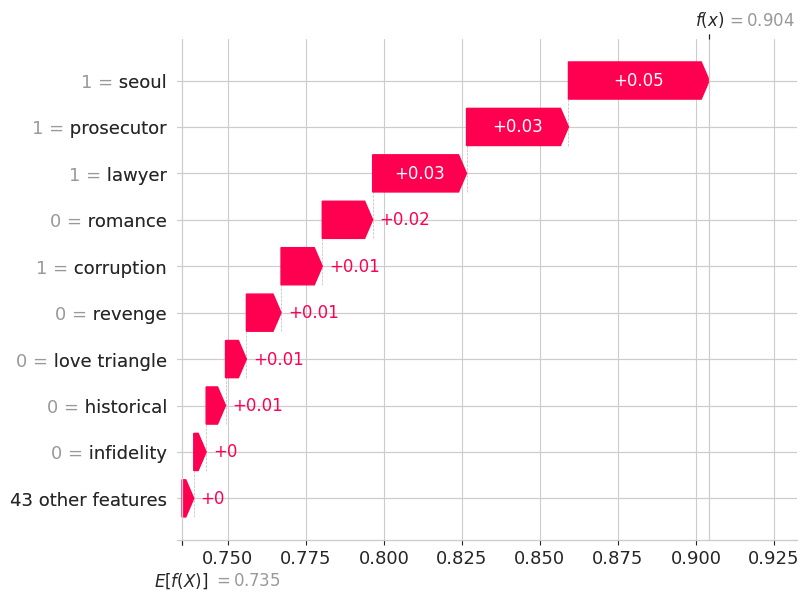
SHAP values measure the effect of each variable on the model. In doing so, the expected value of the actual series is compared to the effect of each variable on the model while all other variables are kept constant. From the graph below, we can see all the variables has a positive effect on the model and Seoul has the most positive effect on the model ceteris paribus. In other words, a small change in the values of Seoul varibale would cause a significant effect on the output of the model.
shap.plots.waterfall(best_models_and_shap[1]['shap_explanation'][9])

Quadrant 2 - Low Budget, High Rating
shap.summary_plot(best_models_and_shap[2]
                  ['shap_explanation'], plot_size=(5, 5))
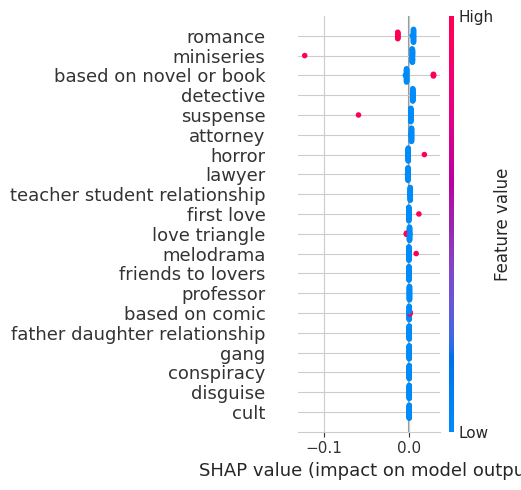
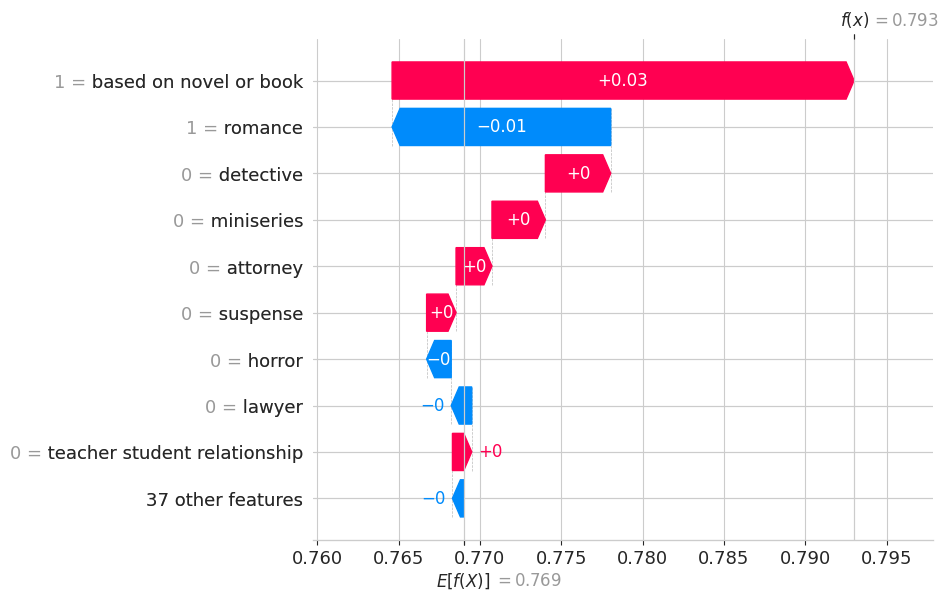
Based on novel or book has the most positive effect on the model for the low budget, high rating quadrant. That is, a small change of the said variable would cause the model predict lower values. This would also mean that based on the graph, based on novel or book controls the output of the model, i.e. a slight change in variable will incur huge effect on the predictions as compared when the other variables have higher values.
shap.plots.waterfall(best_models_and_shap[2]['shap_explanation'][24])

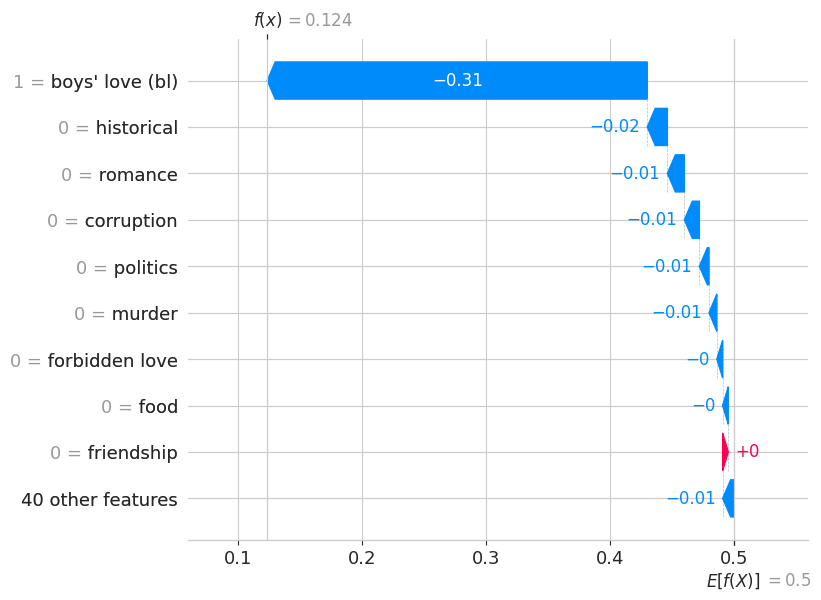
Quadrant 3 - Low budget, Low Rating
shap.summary_plot(best_models_and_shap[3]
                  ['shap_explanation'], plot_size=(5, 5))
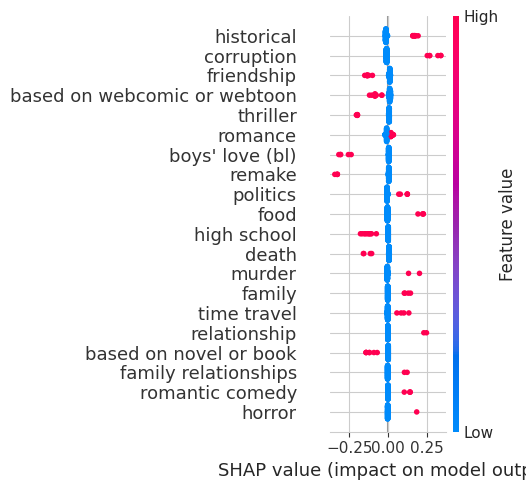
For the low budget, low rating quadrant, most of the variables have a negative effect on the model with respect to the expected value of the actual series. Only based on webcomic or webtoon and friendship has a positive effect on the model. Further, boy's love (bI) has the most negative effect on the model. That is, a small change of the said variable would cause the model predict lower values. This would also mean that based on the graph, the feature boy's love controls the output of the model, i.e. a slight change in the value of boy's love will incur huge effect on the predictions as compared when the other variables have higher values.
shap.plots.waterfall(best_models_and_shap[3]['shap_explanation'][25])

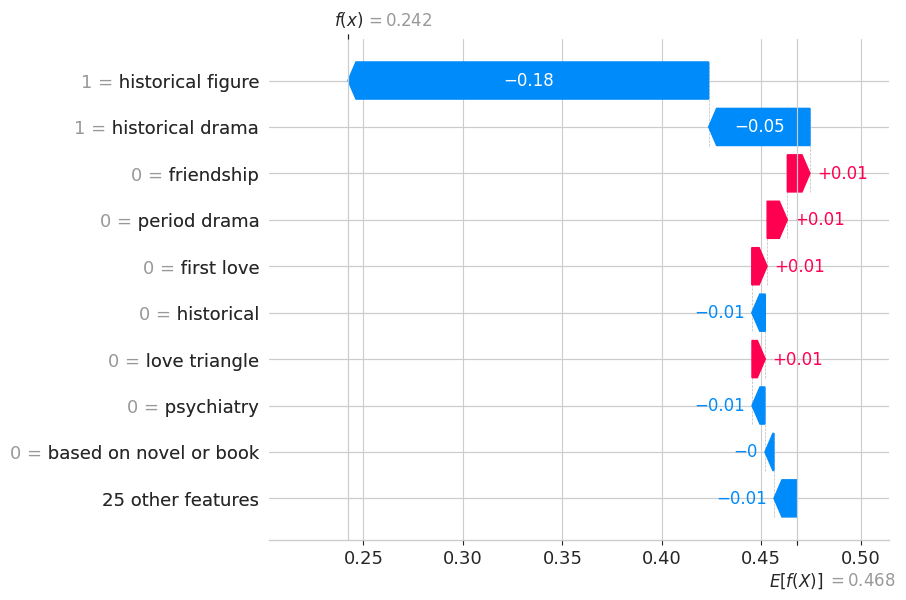
Quadrant 4 - High Budget, Low Rating
shap.summary_plot(best_models_and_shap[4]
                  ['shap_explanation'], plot_size=(5, 5))
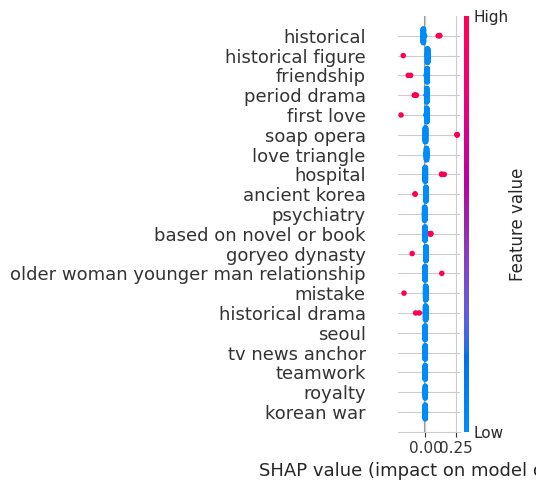
Based on the graph shown below, we can see that historical figure and historical drama are the ones affecting the output of the model. We can see that all the other variables have the same SHAP values and are infereior with respect to historical figure.
shap.plots.waterfall(best_models_and_shap[4]['shap_explanation'][38])
CONCLUSION
The study of the TMDB KDramas 2022 dataset using AI has produced fascinating insights into the factors that drive the popularity of KDrama series. One key finding is that for low budget + high rating series, certain themes and elements do not appear to be as popular among audiences. Specifically, love triangles, mini-series, and suspenseful plotlines seem to have less appeal compared to series that are based on novels or comics, explore horror themes, or delve into the dynamics of boss/employee relationships.
These findings are important for production companies, as they suggest that the choice of themes and plotlines can have a significant impact on the popularity of a KDrama series. By focusing on elements that resonate more strongly with audiences, companies may be able to increase their chances of producing a hit series that generates high ratings and attracts a wide audience.
This analysis also uncovered another intriguing insight: certain historical themes may have a negative impact on the popularity of high budget + low rating series. Specifically, series that explore historical figures, ancient Korea, historical dramas, and the Goryeo dynasty appear to be less popular among viewers. This finding may reflect a shift in audience preferences towards more contemporary themes and plotlines, and could signal an opportunity for producers to explore new ideas and themes that appeal to modern audiences.
In conclusion, this project highlights the value of using AI and data analysis to uncover insights into audience preferences and the factors that drive the success of KDrama series. As the industry continues to evolve and expand, these insights will be invaluable for producers and creators looking to produce high-quality, engaging series that capture the attention of viewers around the world.
RECOMMENDATIONS
Several avenues for future research and expansion of this project are listed below.
Broadly analyzing cost-popularity relationship
It would be useful to conduct further analysis on the relationship between production costs and the popularity of KDrama series. This project focused on high budget + low rating and low budget + high rating series, but there may be additional insights to be gained by exploring the relationship between cost and popularity more broadly. For example, it may be worthwhile to investigate the optimal budget range for producing popular KDrama series.
Exploring other key factors
This project’s analysis focused primarily on plot themes and elements that contribute to the popularity of KDrama series. However, other factors such as casting decisions, marketing strategies, and release timing may also play a role in the success of a series. Future projects could investigate these factors in more detail to gain a more comprehensive understanding of the key drivers of KDrama popularity.
Diversifying data source
This project was limited to data from a single source, the TMDB KDramas 2022 dataset. To obtain a more diverse and representative sample of KDrama series, future projects could incorporate data from additional sources and platforms, such as ratings data from major broadcasters or streaming services. This would allow for a more comprehensive and nuanced analysis of the factors that contribute to the success of KDrama series.

REFERENCES
[1] Collider (2022, December 30). “Why Korean Dramas Are So Much More Addictive Than You Think”. https://collider.com/korean-dramas-addictive/
[2] South China Morning Post (2021, June 26). “How much do K-dramas cost to make? Budgets keep growing, hastened by Netflix’s entry with Kingdom and Sweet Home”. https://www.scmp.com/lifestyle/k-pop/k-drama/article/3138546/how-much-do-k-dramas-cost-make-budgets-keep-growing
ACKNOWLEDGEMENT
I completed this project with my Learning Team, which consisted of Frances Divina Egango, Jed Alvin Guinto, Jose Ramon Jimenez, and Bernadette Obiso.