
WanTED: Data Science
Published:
Executive Summary
This report puts together an Information Retrieval Pipeline involving Youtube API V3 to implement an intelligent search by generating results relevant to the keywords entered by the user.
The use case that we will use in this implementation is the TED Talk YouTube Channel.
Youtube, as a digital platform and video repository is one of the world’s largest data sources.
In this lab report, we conduct Information Retrieval (IR) by:
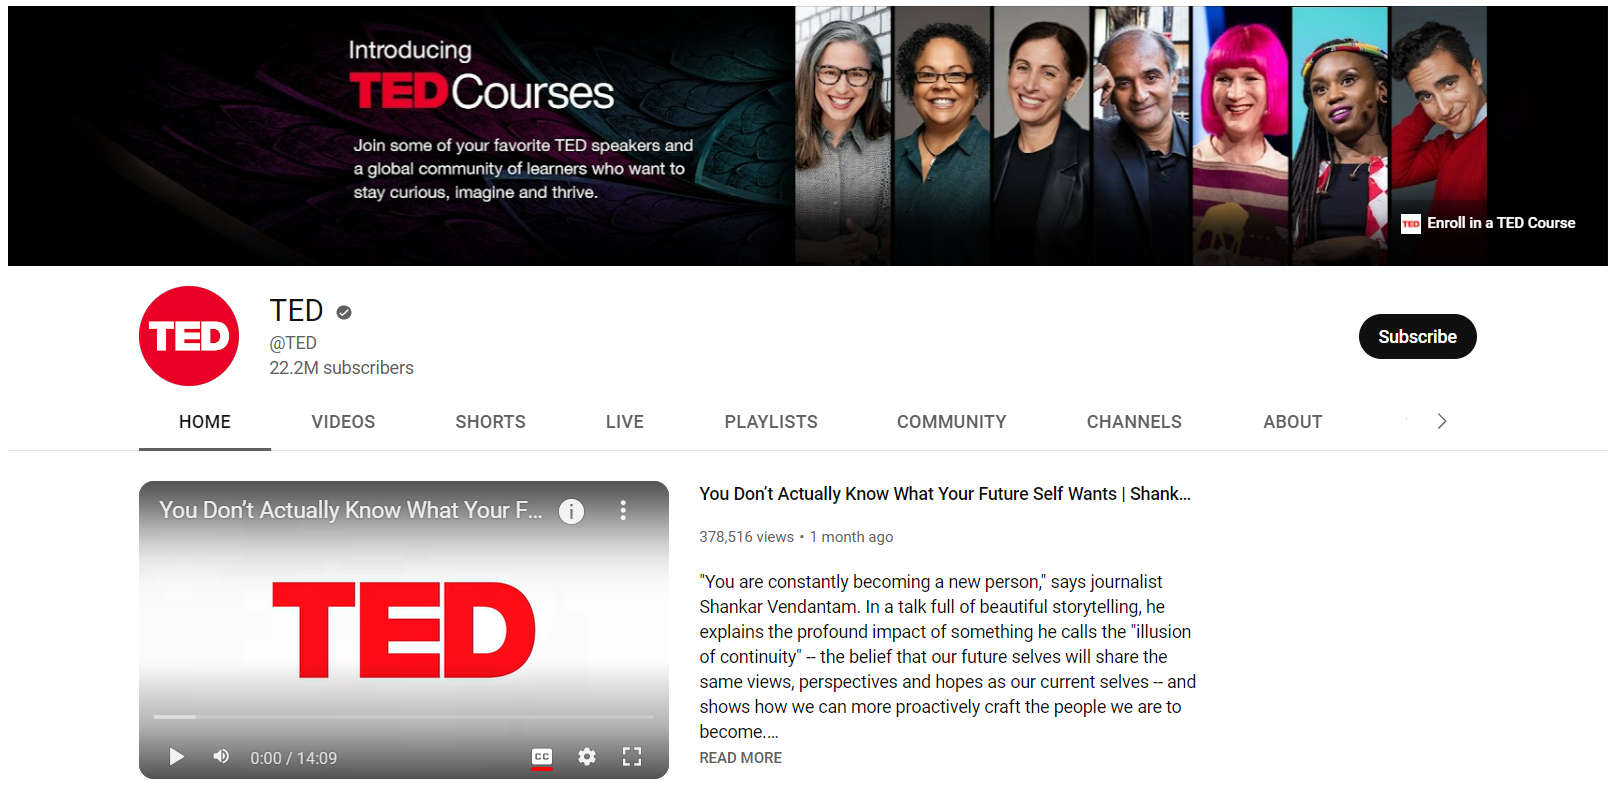
i) accessing TED Talk videos from its YouTube Channel (https://www.youtube.com/@TED) through Youtube API V3;
ii) implementing the Bag-of-Words (BoW) techniques; and
iii) generating relevant list of 10 TED Talk videos based on a user’s query of a topic.
We set out to extract and yield the Top 10 TED Talk titles, descriptions, and playlists that best match in terms of similarity and relevance the keywords entered and searched for by the user.
We implemented BoW to convert and vectorize the text in keywords, TED Talk titles, descriptions, and playlists numerically to compare and calculate the Euclidean distance between them and verify if the keywords are similar to the TED Talk titles, descriptions, and playlists.
The Information Retrieval Pipeline implemented in this report successfully yielded results that match the keyword search of “Data Science”. The Top 10 Data Science Videos featured renowned personalities such as Tim Smith, Dr. Joel Selanikio, and Dr. Talithia Williams - known leaders and experts in the field of data architecture, data engineering, health data and technology, and applied computational statistics.
A comparison between the Information Retrieval Implementation Results and the YouTube search results through the precision (0.20-0.25) and recall (0.20-0.25) statistics, among others, reveal that there is still a vast room for improvement in terms of yielding results that are most similar and relevant to the user’s keyword search.
Moving forward, we can explore other techniques to complement and reinforce BoW, go beyond the literal and focus on the context of words for greater insight and better statistics. Detecting the similarity between the words ‘data’ and ‘information’, requires more information and deeper study on various DMW and IR techniques.
Problem Statement
A user browsing a channel on YouTube does not necessarily know the exact title of the video of interest. Hence, the user would enter keywords and hope that YouTube will generate results most similar and relevant to the keywords entered. The user can now choose and watch the most relevant video from the list of results.
The problems we are solving in this report are:
1) How do we implement an intelligent search of Videos on YouTube using keywords as a query?
2) How do we yield the most similar and relevant results to the user?
Resolving these problems ensures that the user finds similar and relevant results to the keyword search.
Our specific use case for this report is the keyword Data Science on the YouTube channel TED.
Introduction
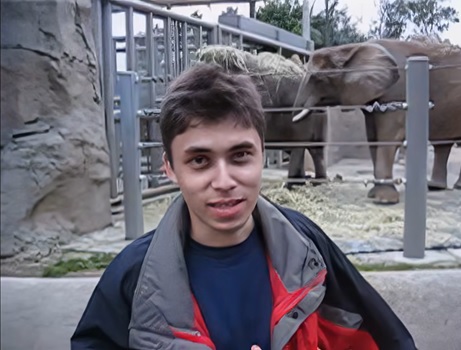
YouTube is an online video-sharing platform established on February 14, 2005, by previous PayPal employees Steve Chen, Chad Hurley, and Jawed Karim. The first video uploaded on the site was on April 23, 2005, entitled “Me at the zoo”. [2] [3] In May of that same year, the beta was launched, and by November, a video finally reached one million views – a Nike ad featuring Ronaldinho. [4]
Now YouTube is the second most visited website next to Google, generating over a billion hours of video played daily. There are localized versions of YouTube in over 100 countries worldwide across 80 languages. More than 500 hours of content are uploaded to the platform every minute. That is equivalent to 30,000 hours of video uploaded every hour, and 720,000 hours of video uploaded daily. [5] [6]
As of 2015, searches related to “how to” are growing 70% year-over-year, which means that users rely on video content when they want to learn something. [7]
TED is a nonprofit devoted to spreading ideas, usually in the form of short, powerful talks (18 minutes or less). TED began in 1984 as a conference where Technology, Entertainment and Design converged, and today covers almost all topics — from science to business to global issues — in more than 100 languages. Meanwhile, independently run TEDx events help share ideas in communities around the world. Richard Saul Wurman founded TED, and together with Harry Marks, created the first TED that included a demo of the compact disc, an e-book and cutting-edge 3D graphics from Lucasfilm, and a demonstration of Benoit Mandelbrot of mapping coastlines using his developing theory of fractal geometry.
However, the success of TED won’t be seen until six years after. The TED Conference became an annual event in Monterey, California, attracting a growing and influential audience from many different disciplines united by their curiosity and open-mindedness – and also by their shared discovery of an exciting secret. Back then, TED was an invitation-only event. [8]
Methodology
An Information Retrieval pipeline will be created to solve the problems stated above. The following methodology is detailed below.
A. Data Extraction
- The data will be retrieved from
Youtube API V3using a private API key. The API key will not be provided within this notebook. If the user wishes to re-pull data fromYoutube, he/she must provide his/her API key using thegetpass()method below. - A function
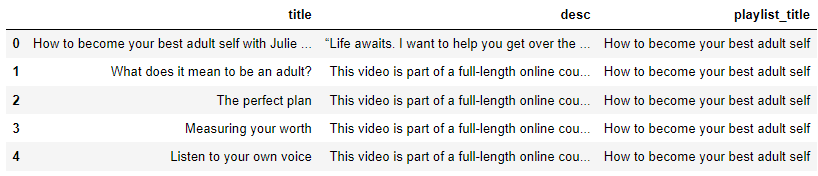
user_videosis defined to pull data from a specifiedchannel_idusing theapi_keyprovided. This function will go through all playlists in the channel. In addition, each video title and description of each channel will be added to the database. The final database contains the following details of each video:title,desc(this refers to the description of the title), andplaylist_title. - For testing and implementation of the notebook,
channel_idwill be set to the youtube channel of TED, and the query will be set to Data Science.
B. Data Cleaning
- The retrieved data from
Youtube API V3will be cleaned by dropping all duplicates and nulls.
C. Data Preprocessing
- The following functions/class will be defined to be used in the IR problem.
preprocess- used to remove common english words in our corpus.to_bow- used to convert the corpus of data into a bag of words.cossim- used to define cosine similarity.dcos- used to measure the distance between two vectors. This distance measurement will be used as this is advantageous for vectors that are similar but far apart in terms of Euclidean distance due to the size of the document.- Class
Vectorizer- used to vectorize the query using the word mappings from the corpus.
D. Results and Discussions
- For a quick overview of our corpus, a plot showing the number of videos per playlist is shown.
- Wordcloud is also generated to show the top word in the query results.
- The results of the query will be measured using the following: confusion matrix, precision, recall, f-score, PR-curve, and AUC-PR.
Data Source and Description
The data source for this project is the API of YouTube [9] - the most popular video streaming app. YouTube accounts for the greatest total time spent using social media apps on Android phones, and it also clocks the highest average time per user. App Annie’s research indicates that the typical YouTube user now spends almost a full day – 23.7 hours – per month using YouTube’s mobile app. [10]
It’s also the second-largest search engine [11] and the most visited site on the internet [12].
The features of YouTube API allow the use of predefined functions and protocols to access large volumes of YouTube videos, including retrieval of video titles, descriptions, and playlists without the need to access individual videos and channels like TED Talk.
The YouTube API functionality used widely in this lab report is the following:
| YouTube Resource | Example HTTP Request | Description |
|---|---|---|
| YouTube Videos | GET / channels | Retrieves a channel’s videos, titles, descriptions, playlists |
Data Exploration
from IPython.display import display, HTML
import requests
import pandas as pd
import numpy as np
import getpass
import time
import random
from collections import Counter
import re
from sklearn.feature_extraction.text import TfidfVectorizer, CountVectorizer
from nltk.corpus import stopwords
from nltk.stem.snowball import SnowballStemmer
import matplotlib.pyplot as plt
%matplotlib inline
from scipy.spatial.distance import cosine
from wordcloud import WordCloud, STOPWORDS, ImageColorGenerator
from nltk.tokenize import RegexpTokenizer
from nltk.corpus import stopwords
import nltk
from nltk.corpus import wordnet
from nltk.stem import WordNetLemmatizer
from PIL import Image
from scipy.spatial.distance import euclidean
from scipy.spatial.distance import cosine
nltk.download('wordnet')
nltk.download('stopwords')
nltk.download('omw-1.4');
random.seed(10)
API Data Extraction
api_key = getpass.getpass()

def search_videos(channel_id, search_query, api_key):
    """Returns the video title, description and playlist title of videos from
    the input channel_id and search query using the api_key."""
    search_result = []
    channel_id = 'UCAuUUnT6oDeKwE6v1NGQxug'
    endpt = 'https://www.googleapis.com/youtube/v3/search'
    params = {'part': 'id,snippet',
              'channel_id': channel_id,
              'q': search_query,
              'maxResults': 50,
              'key': api_key}
    while True:
        resp = (requests.get(endpt, params=params).json())
        for i in resp['items']:
            search_result.append(i['snippet']['title'])
        if 'nextPageToken' in resp:
            params.update({'pageToken': resp['nextPageToken']})
            time.sleep(2)
        else:
            break
    return pd.DataFrame(search_result, columns=['target'])

def user_videos(channel_id, api_key):
    """Returns the video title, description and playlist title of videos from
    the input channel_id using the api_key."""
    v_title = []
    v_desc = []
    p_title = []
    playlist_id = []
    playlist_title = []

    endpt = 'https://www.googleapis.com/youtube/v3/playlists'
    params = {'part': 'id,snippet',
              'channel_id': channel_id,
              'maxResults': 50,
              'key': api_key}
    while True:
        resp = (requests.get(endpt, params=params).json())
        for i in resp['items']:
            playlist_id.append((i['id'], i['snippet']['title']))
            playlist_title.append(i['snippet']['title'])
        if 'nextPageToken' in resp:
            params.update({'pageToken': resp['nextPageToken']})
            time.sleep(1)
        else:
            break

    for y in playlist_id:
        endpt = 'https://www.googleapis.com/youtube/v3/playlistItems'
        params1 = {'part': 'snippet',
                   'playlistId': y[0],
                   'maxResults': 50,
                   'key': api_key}
        while True:
            resp = (requests.get(endpt, params=params1).json())
            for i in resp['items']:
                v_title.append(i['snippet']['title'])
                v_desc.append(i['snippet']['description'])
                p_title.append(y[1])
            if 'nextPageToken' in resp:
                params1.update({'pageToken': resp['nextPageToken']})
                time.sleep(1)
            else:
                break
    v_dict = {'title': v_title, 'desc': v_desc, 'playlist_title': p_title}

    return pd.DataFrame(v_dict)

channel_id = 'UCAuUUnT6oDeKwE6v1NGQxug'  # TED youtube channel
df_videos = user_videos(channel_id, api_key)
display(df_videos.head())

search_query = "Data Science"
df_search = search_videos(channel_id, search_query, api_key)
display(df_search.head())
Data Cleaning
# Dropping duplicate values
df_videos.drop_duplicates(subset=['title'], inplace=True)

# Creating a copy of the df
videos_df = df_videos.copy()

# Check null values
display(videos_df.isnull().sum() / len(videos_df))
Data Preprocessing
def preprocess(document):
"""Accepts documents and returns only the necessary words."""
wordnet_lemmatizer = WordNetLemmatizer()
tokenizer = RegexpTokenizer(r'[a-z]+')
stop_words = set(stopwords.words('english'))
document = document.lower() # Convert to lowercase
words = tokenizer.tokenize(document) # Tokenize
words = [w for w in words if not w in stop_words] # Removing stopwords
# Lemmatizing
for pos in [wordnet.NOUN, wordnet.VERB, wordnet.ADJ, wordnet.ADV]:
words = [wordnet_lemmatizer.lemmatize(x, pos) for x in words]
return " ".join(words)
videos_df['new_title'] = videos_df['title'].apply(preprocess)
videos_df['new_desc'] = videos_df['desc'].apply(preprocess)
videos_df['new_playlist_title'] = videos_df['playlist_title'].apply(preprocess)
videos_df['final'] = ((videos_df['new_playlist_title']
+ " " + videos_df['new_title']
+ " " + videos_df['new_desc']).apply(preprocess))
results_df = videos_df.reset_index(drop=True).copy()
result_df = (pd.merge(results_df, df_search,
left_on='title', right_on='target', how='left'))
result_df['target'][result_df['target'].isnull()] = 0
result_df['target'][result_df['target'] != 0] = 1
videos_df.set_index('new_title', inplace=True)
final_videos = videos_df['final']
final_videos.head()
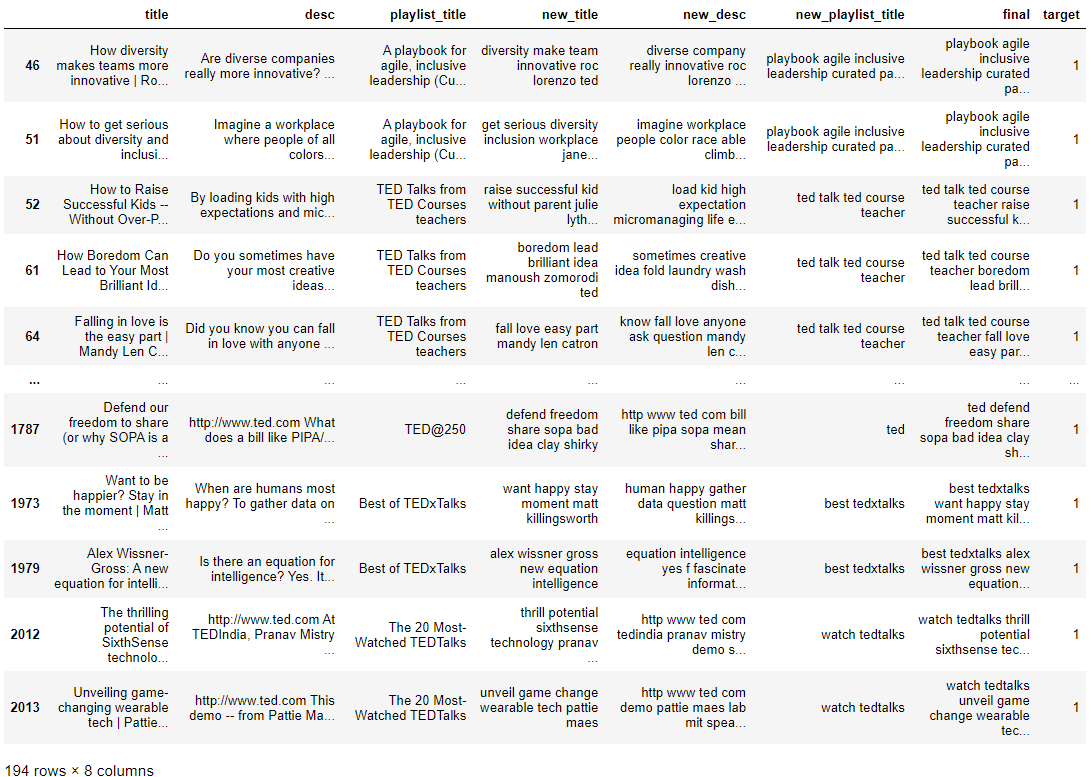
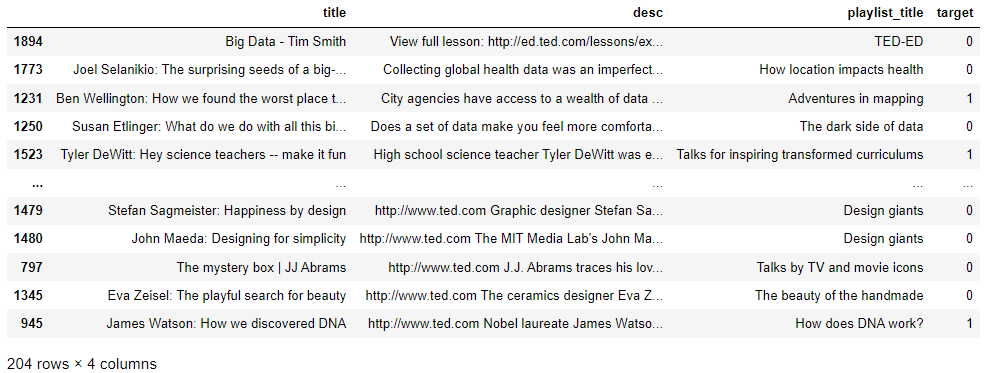
# Actual relevant results to "Data Science"
display(result_df[result_df['target'] == 1])
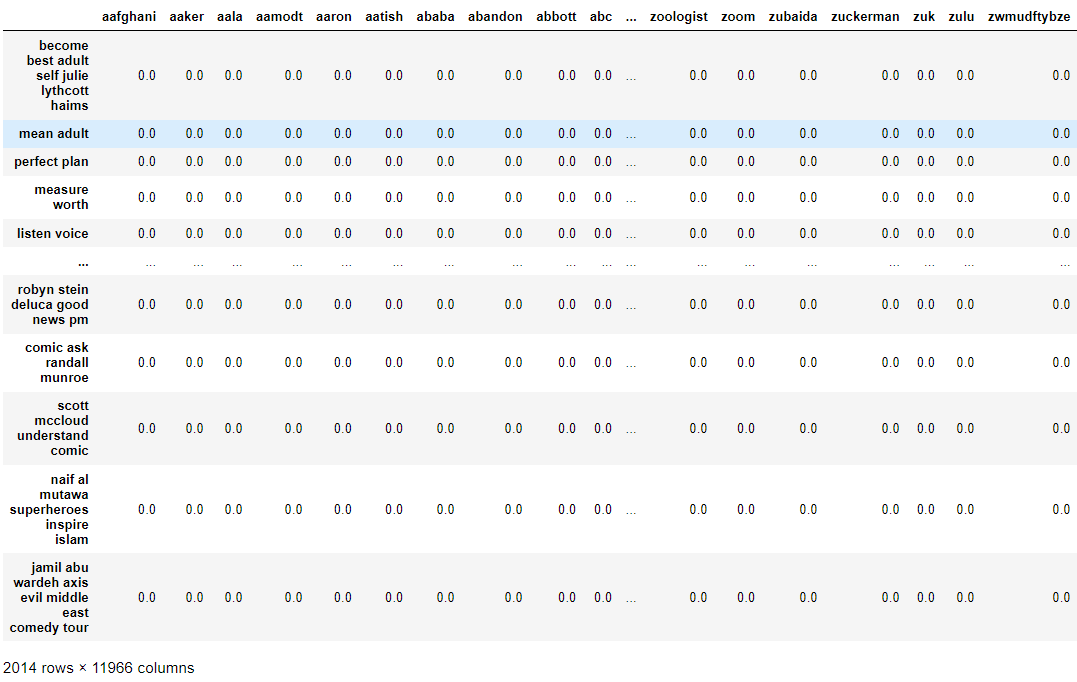
Bag-of-words representation
def to_bow(docs):
    """Accepts a list of documents and returns a pandas DataFrame of their
    bag-of-words representation."""
    docs = [doc.lower() for doc in docs]
    df = pd.DataFrame([Counter(doc.split()) for doc in docs])
    df.fillna(0, inplace=True)
    return df.reindex(sorted(df.columns), axis=1)

bow_df = to_bow(final_videos)
bow_df.rename(index={x: y for x, y in enumerate(final_videos.index)},
              inplace=True)
display(bow_df)
Cosine Similarity, Cosine Distance, Nearest_k
def cossim(vec1, vec2):
    """Compute cosine similarity between vec1 and vec2."""
    if vec1.ndim == 1:
        return (np.dot(vec1, vec2) /
                (np.linalg.norm(vec1) * np.linalg.norm(vec2)))
    else:
        return (np.dot(vec1, vec2) /
                (np.linalg.norm(vec1, axis=1) * np.linalg.norm(vec2, axis=1)))

def dcos(vec1, vec2):
    """Compute cosine distance between vec1 and vec2."""
    distance = cossim(vec1, vec2)
    return 1 - cossim(vec1, vec2)

def nearest_k(query, objects, k, dist):
    """Return the indices to objects most similar to query."""
    return np.argsort([dist(query, obj) for obj in objects])[:k]
Vectorizer
class Vectorizer:
    def __init__(self):
        self.index_word = {}
        self.word_index = {}

    def build_mappings(self, docs):
        """Initialize word-index mappings."""
        words = sorted(set(" ".join(docs).split()))
        self.index_word = {i: word for i, word in enumerate(words)}
        self.word_index = {
            word.lower(): i for i, word in self.index_word.items()}

    def vectorize(self, doc):
        """Return the BoW vector representation of doc."""
        words = dict.fromkeys(self.word_index, 0)
        freq = Counter(doc.lower().split())
        for i in freq.keys():
            if i in words.keys():
                words[i] = freq[i]
        return pd.Series(words).sort_index().values.astype(float)
Results and Discussions
Top Results
def trigger(text, top_count):
    """Accepts the text query and searches for the most similar youtube video,
    returns the details of the top_count number of videos."""
    vectorizer = Vectorizer()
    vectorizer.build_mappings(list(final_videos.values))
    result = ((bow_df.iloc[
        nearest_k(
            vectorizer.vectorize(text),
            bow_df.to_numpy(),
            top_count,
            dcos)
    ]))
    return result

text = "Data Science"
result = trigger(text, -1)
final_df = (pd.DataFrame([result_df.iloc[result_df[result_df['new_title']
            == i].index[0]] for i in result.index])
            .drop(columns=['final', 'new_title',
                           'new_desc', 'new_playlist_title']))
final_df = final_df[~final_df.index.duplicated(keep='first')]

# Predicted Top 204
top_df = final_df[:204]
display(top_df)
Exploratory Data Analysis
fig_num = 3
def fig_caption(title, caption):
    global fig_num
    """Print figure caption on jupyter notebook"""
    display(HTML(f"""<p style="font-size:12px;font-style:default;"><center><b>
                     Figure {fig_num}. {title}.</b><br>{caption}</center></p>"""))
    fig_num += 1
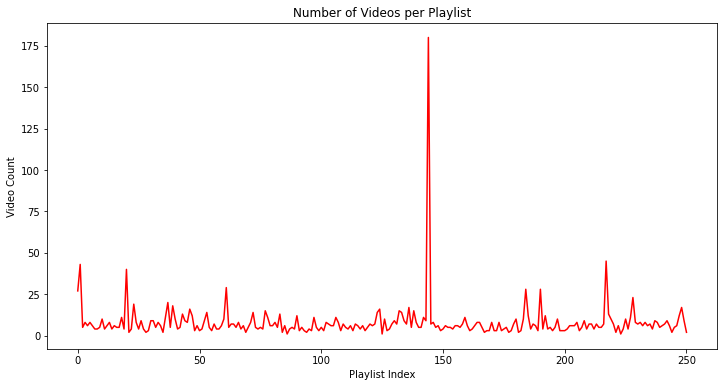
Plot of data from Corpus
fig, ax = plt.subplots(figsize=(12, 6))
ax.plot(df_videos.groupby('playlist_title', as_index=False)['title'].count().index,
        df_videos.groupby('playlist_title', as_index=False)['title'].count()['title'], color='red')
ax.set_xlabel('Playlist Index')
ax.set_ylabel('Video Count')
ax.set_title('Number of Videos per Playlist')
plt.show()
fig_caption('Number of Videos per Playlist', '')
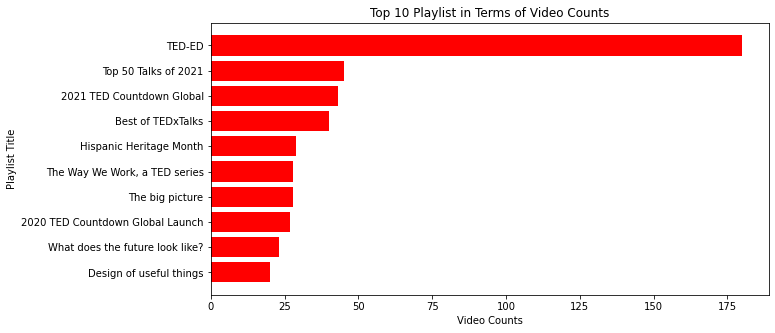
fig, ax = plt.subplots(figsize=(10, 5))
ax.barh((df_videos['playlist_title'].value_counts()
         .head(10).sort_values().index),
        (df_videos['playlist_title'].value_counts()
         .head(10).sort_values().values), color='red')
ax.set_xlabel('Video Counts')
ax.set_ylabel('Playlist Title')
ax.set_title('Top 10 Playlist in Terms of Video Counts')
plt.show()
fig_caption('Top 10 Playlist in Terms of Video Counts', '')

display(df_videos['playlist_title'].value_counts())
Insights
TED-EDis the playlist with most videos (180 videos).- The rest of the playlist included in the database have videos less than 50.
fig, ax = plt.subplots(figsize=(10, 5))
ax.barh((df_videos['playlist_title'].value_counts()
         .tail(10).sort_values().index),
        (df_videos['playlist_title'].value_counts()
         .tail(10).sort_values().values), color='red')
ax.set_xlabel('Video Counts')
ax.set_ylabel('Playlist Title')
ax.set_title('Bottom 10 Playlist in Terms of Video Counts')
plt.show()
fig_caption('Bottom 10 Playlist in Terms of Video Counts', '')
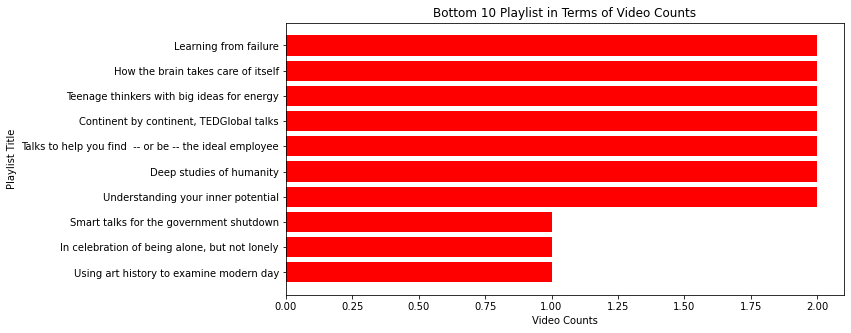
Insights
- Playlist has minimum count of 1 video.
- Three playlists contain the minimum count of videos.
Word Cloud
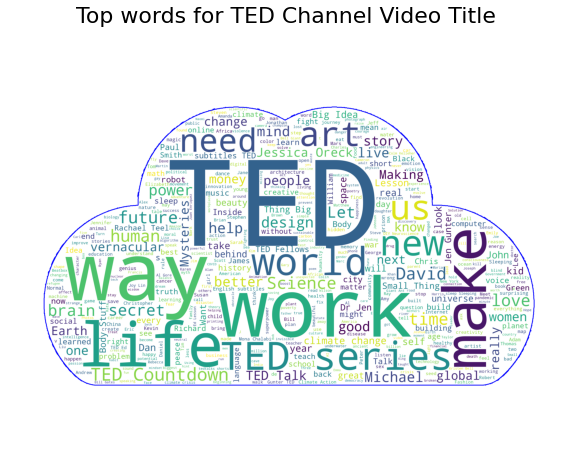
# Word cloud for all the video title in the database
mask = np.array(Image.open('./cloud.png'))
wc = WordCloud(
    background_color='white',
    max_words=500,
    mask=mask,
    contour_width=5,
    contour_color='blue',
)
wc.generate(' '.join(text for text in df_videos['title']))
fig, ax = plt.subplots(figsize=(10, 10))
ax.set_title('Top words for TED Channel Video Title',
              fontdict={'size': 22,  'verticalalignment': 'bottom'})
ax.imshow(wc)
ax.axis("off")
plt.show()
fig_caption('Top words for TED Channel Video Title', '')
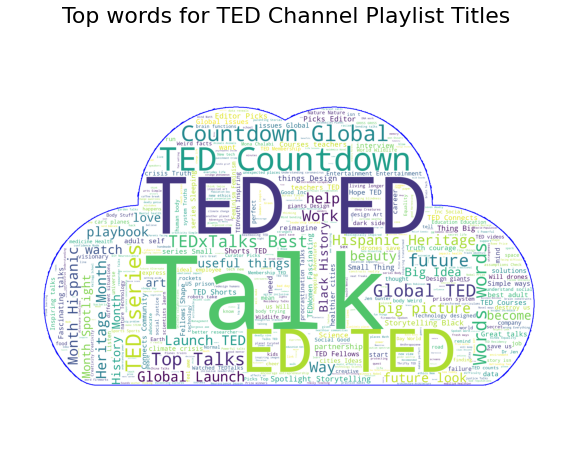
# Word cloud for all the playlist title in the database
mask = np.array(Image.open('./cloud.png'))
wc = WordCloud(
    background_color='white',
    max_words=500,
    mask=mask,
    contour_width=5,
    contour_color='blue',
)
wc.generate(' '.join(text for text in df_videos['playlist_title']))
fig, ax = plt.subplots(figsize=(10, 10))
ax.set_title('Top words for TED Channel Playlist Titles',
          fontdict={'size': 22,  'verticalalignment': 'bottom'})
ax.imshow(wc)
ax.axis("off")
plt.show()
fig_caption('Top words for TED Channel Playlist Titles', '')
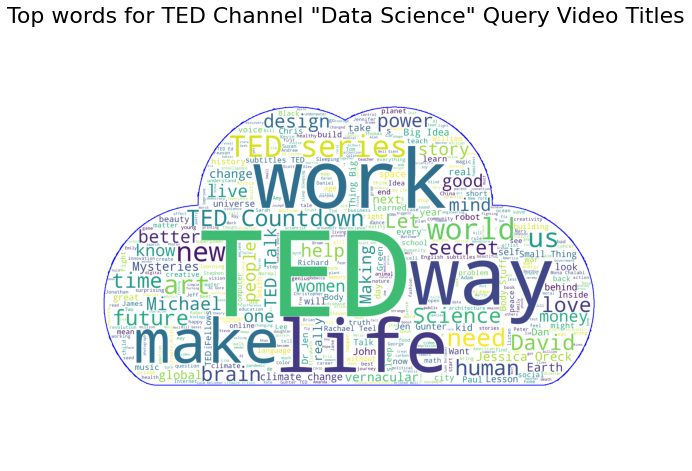
# Word cloud for all the video title in the "Data Science" query
mask = np.array(Image.open('./cloud.png'))
wc = WordCloud(
    background_color='white',
    max_words=500,
    mask=mask,
    contour_width=5,
    contour_color='blue',
)
wc.generate(' '.join(text for text in final_df['title']))
fig, ax = plt.subplots(figsize=(10, 10))
ax.set_title('Top words for TED Channel "Data Science" Query Video Titles',
          fontdict={'size': 22,  'verticalalignment': 'bottom'})
ax.imshow(wc)
ax.axis("off")
plt.show()
fig_caption('Top words for TED Channel "Data Science" Query Video Titles', '')
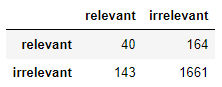
Confusion Matrix
def get_confusion(actual, results, all_labels):
    """Accepts the label of the correct class, the returned results as indices
    to the objects and all labels, and returns the confusion matrix
    as a pandas DataFrame."""
    tp = len([i for i in results if all_labels[i] == actual])
    fp = len(results) - tp
    fn = len([i for i in all_labels if i == actual]) - tp
    tn = len(all_labels) - tp - fp - fn
    df = pd.DataFrame([[tp, fp], [fn, tn]],
                      columns=['relevant', 'irrelevant'],
                      index=['relevant', 'irrelevant'])

    return df

confusion_vids = get_confusion(1, top_df.index, final_df['target'])
display(confusion_vids)
Precision and Recall
def precision(confusion):
    """
    The function accepts a confusion matrix and returns the precision.
    """

    TP = confusion.loc['relevant', 'relevant']
    FP = confusion.loc['relevant', 'irrelevant']
    return TP / (TP + FP)

def recall(confusion):
    """
    The function accepts a confusion matrix and returns the call.
    """

    TP = confusion.loc['relevant', 'relevant']
    FN = confusion.loc['irrelevant', 'relevant']
    return TP / (TP + FN)

pr_val = precision(confusion_vids)
re_val = recall(confusion_vids)

print(f'Precision of Data Science as query: {pr_val:0.2f}')
print(f'Recall of Data Science as query: {re_val:0.2f}')
F-Measure
def f_measure(precision, recall, beta=1):
    """
    The function accepts the precision, recall and beta
    and returns the F-measure.
    """

    left = 1 + beta**2
    right = (precision * recall) / ((beta**2 * precision) + recall)
    return left * right

print('F1-score for Data Science as query: %0.2f' %
      f_measure(precision(confusion_vids), recall(confusion_vids)))

print('F2-score for Data Science as query: %0.2f' %
      f_measure(precision(confusion_vids), recall(confusion_vids), 2))

print('F0.5-score for Data Science as query: %0.2f' %
      f_measure(precision(confusion_vids), recall(confusion_vids), 0.5))
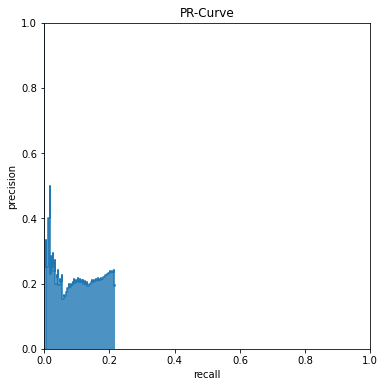
PR Curve
def pr_curve(actual, results, all_labels):
    rs = (all_labels[results] == actual).cumsum()
    N = (all_labels == actual).sum()
    precisions = rs / np.arange(1, len(rs)+1)
    recalls = rs / N
    recalls = [0] + recalls.tolist()
    precisions = [1] + precisions.tolist()

    fig, ax = plt.subplots(figsize=(12, 6))
    ax.set_aspect('equal')
    ax.step(recalls, precisions, where='post')
    ax.fill_between(recalls, precisions, step='post', alpha=0.8)
    ax.set_xlim(0,1)
    ax.set_ylim(0,1)
    ax.set_xlabel('recall')
    ax.set_ylabel('precision')
    ax.set_title('PR-Curve')
    plt.show()
    fig_caption('PR-Curve', '')
    return ax

pr_curve(1, top_df.index, final_df['target']);
AUC-PR
def auc_pr(actual, results, all_labels):
    """
    The function accepts the query, objects and results
    and returns the area under the pr curve.
    """
    from scipy.integrate import trapz
    rs = (all_labels[results] == actual).cumsum()
    N = (all_labels == actual).sum()
    precisions = rs / np.arange(1, len(rs)+1)
    recalls = rs / N
    recalls = [0] + recalls.tolist()
    precisions = [1] + precisions.tolist()
    return trapz(precisions, recalls)

print('The AUC-PR for the first Video as query: %0.2f.' %
      auc_pr(1, top_df.index, final_df['target']))
Conclusion
The Problems We Wanted To Solve
The Information Retrieval pipeline provided a systematic way of solving the following problems we set at the beginning:
1) How do we implement an intelligent search of Videos on YouTube using keywords as query?
2) How do we yield results that are most similar and relevant to the user?
The Steps We Followed To Solve The Problems
Data Extraction of the video title, playlist, and description through Youtube API V3 from a specified channel_id, which for this report’s use case is the TED Talk Youtube Channel was conducted. Then Data Cleaning was performed to ensure that the data is free of duplicates and nulls. Subsequently, Data Preprocessing was completed through application of the BoW, Cosine Similarity, Measurement of Distance between Vectors, and Vectorizer in order to convert the corpus of data into a bag of words, vectorize the query and mapping it to the corpus, define cosine similarity, measure the distance between two vectors, and catch vectors that are similar but far apart in terms of Euclidean distance due to the size of the document.
In the Information Retrieval Implementation we used “Data Science” as query to test the Information Retrieval pipeline and evaluate the Top 10 Search Results.
Conclusion: The Results Solved The Problems But The Stats Could Still Be Improved
The Top 10 Data Science Videos featured renowned personalities in the field of data architecture, data engineering, health data and technology, and applied computational statistics on data.
The top results show videos of: 1) Tim Smith - A Data Architect, published in tech magazines hundreds of times and produced technical video how-to content, one of which is his YouTube channel SQL In Six Minutes.[13]
2) Dr. Joel Selanikio - The CEO of DataDyne, a social business working in fields such as international development and global health. [14]
The Information Retrieval pipeline consistently delivered similar and relevant results up to the 10th result, which is a video of Dr. Talithia Williams who takes on sophisticated numerical concepts and makes them understandable to a wide audience in amusing and insightful ways, using statistics as a way of seeing the world in a new light. [15]
Upon comparison of the Information Retrieval Implementation Results with the YouTube results through the following statistics, we observe that there is still a vast room for improvement in terms of yielding results that are most similar and relevant to the user’s keyword search:
| Precision | Recall | F1 Score | F2 Score | F0.5 Score | AUC-PR |
|---|---|---|---|---|---|
| 0.20 | 0.22 | 0.21 | 0.21 | 0.20 | 0.05 |
More Insights
The Exploratory Data Analysis of the Database and Information Retrieval Implementation features a quick overview of our corpus, through three plots showing the number of videos per playlist, the leading playlists in terms of video count, and the lagging ones or the ones with the least count of videos at Section 8.2.1 of this report. The plot shows the following insights:
1) TED-ED is the playlist with most videos (180 videos).
2) The rest of the playlist included in the database have videos less than 50.
3) Playlist has minimum count of 1 video.
4) Three playlists contain the minimum count of video.
Moreover, in Section 8.2.2, we generated a WordCloud to visualize the top words in the query results. Top words in the TED Channel include: TED, way, work, life, make, new, art, series, need, future.
Recommendations
We were able to get a precision and recall of 0.20 and 0.22, respectively using bag-of-words and cosine similarity. We recommend improving the model using more sophisticated models and machine learning algorithms that can put more weight on variables in some queries. Normalization techniques can also be used to improve the model and gain better precision and recall.
References
[1] TED (2006, December 7) Home [@TED]. Youtube. Retrieved November 24, 2022, from https://www.youtube.com/@TED/featured
[2] jawed (2005, April 24) Me at the zoo [Video]. Retrieved November 24, 2022, from https://www.youtube.com/watch?v=jNQXAC9IVRw&ab_channel=jawed
[3] YouTube (2007, September 26) The Making of YouTube [Video]. Retrieved November 24, 2022, from https://www.youtube.com/watch?v=X2N_V2dfS1U&ab_channel=YouTube
[4] Stroud, J. (2022, February 16) Ronaldinho: Barcelona legend was star of first YouTube video to hit 1 mil views. Retrieved November 24, 2022, from https://www.givemesport.com/87973806-ronaldinho-barcelona-legend-was-star-of-first-youtube-video-to-hit-1-mil-views
[5] Youtube (n.d.) YouTube for Press. Retrieved November 24, 2022, from https://blog.youtube/press/
[6] Hale, J (2019, May 7) More Than 500 Hours Of Content Are Now Being Uploaded To YouTube Every Minute. Retrieved November 24, 2022, from https://www.tubefilter.com/2019/05/07/number-hours-video-uploaded-to-youtube-per-minute/
[7] Gesenhues, A. (2015, May 13) YouTube “How To” Video Searches Up 70%, With Over 100 Million Hours Watched In 2015. Retrieved November 24, 2022, from https://searchengineland.com/youtube-how-to-searches-up-70-yoy-with-over-100m-hours-of-how-to-videos-watched-in-2015-220773
[8] TED (n.d.) History of TED. Retrieved November 24, 2022, from https://www.ted.com/about/our-organization/history-of-ted
[9] Youtube (n.d.) About Youtube. Retrieved November 24, 2022, from https://about.youtube/
[10] Kemp, S. (2022, January 26) Digital 2022: Global Overview Report. Retrieved November 24, 2022, from https://datareportal.com/reports/digital-2022-global-overview-report
[11] Global Reach (2020, January 28) The 2nd Largest Search Engine on the Internet. Retrieved November 24, 2022, from https://www.globalreach.com/global-reach-media/blog/2020/01/28/the-2nd-largest-search-engine-on-the-internet
[12] Hardwick, J. (2022, July 27) Top 100 Most visited Websites In The World. Retrieved November 24, 2022, from https://ahrefs.com/blog/most-visited-websites/
[13] Smith, T. (n.d.) About me. Retrieved November 24, 2022, from https://www.udemy.com/user/sqlinsixminutes/
[14] Selanikio, J. (n.d.) Dr. Joel Selanikio combines technology and data to help solve global health challenges. Retrieved November 24, 2022, from https://www.ted.com/speakers/joel_selanikio
[15] Williams, T. (n.d.) Professor | Author Speaker | TV Host. Retrieved November 24, 2022, from https://www.talithiawilliams.com/
ACKNOWLEDGEMENT
I completed this project with my Sub Learning Team, which consisted of Felipe Garcia Jr. and Vanessa delos Santos.