
A World of Flavors: Exploring Cities and Other Food Choices
Published:

EXECUTIVE SUMMARY
As we emerge from the pandemic and start to travel again, deciding where to eat can be a daunting task for many. With an abundance of options and individual preferences, it can be challenging to choose the right restaurant for a satisfying and enjoyable meal. This is where personalized recommender systems come in, utilizing machine learning algorithms to generate accurate recommendations based on users’ past preferences and restaurant characteristics.
In this research project, we focused on Florida, a state renowned for its gastronomical diversity and tourism, and developed a restaurant recommender system utilizing collaborative filtering and content-based methods. By leveraging the Yelp dataset, we were able to generate personalized recommendations for users, taking into account factors such as parking, seating arrangements, and reviews.
The findings of this project have important implications for the restaurant industry, as personalized recommendations can improve the dining experience for customers and potentially increase business for restaurants. Moreover, this project highlights the value of machine learning and data-driven approaches in improving the customer experience and business outcomes in the restaurant industry.
However, it is important to acknowledge the potential limitations of relying solely on user-generated data and the assumption that past preferences accurately reflect current preferences. Future research could focus on expanding the dataset and incorporating other factors, such as location-based data and social media data, to further enhance the accuracy and effectiveness of personalized recommendations.
Overall, this project provides a valuable insight into the potential of machine learning and data-driven approaches in improving the customer experience and business outcomes in the restaurant industry, making it an intriguing and intuitive field for further exploration.
INTRODUCTION
Motivation
The COVID-19 pandemic has disrupted the travel industry for almost two years. As restrictions are being lifted, people are eager to go out and explore new places and cultures. The United States may be on the top of their list for some, with its diverse landscape and people, presenting a great opportunity for travel and exploration.
Eating is an integral part of the travel experience, but deciding where can be daunting with so many options available. Food is not just a source of pleasure; it is a fundamental need that sustains our bodies and energizes us for daily activities. Therefore, it is essential to make informed decisions about what and where to eat [1].
Florida is among the top gastronomically diverse states in the US, featuring a blend of Caribbean, Latin American, and Southern cuisines [2]. Accordingly, this research project aims to develop a restaurant recommender system utilizing collaborative filtering and content-based methods to suggest similar restaurants to users based on their previous preferences and restaurant characteristics.
To achieve this, we will use the Yelp dataset, which includes restaurant ratings and reviews provided by users. Although California is famous for its diverse cuisine, only a few cities were included in the dataset, limiting its use for this project. Therefore, Florida was selected as a subset, as it is renowned for its diverse cuisine and is a popular tourist destination.
Florida is one of the most visited states in the US, with over 131 million tourists in 2020 [3]. Moreover, Miami is recognized as one of the most ethnically diverse cities in the US, with over 72% of its population being of Hispanic or Latino origin [4]. Miami’s diverse population has led to a fusion of Latin American and Caribbean cuisines.
By focusing on Florida, a state renowned for its gastronomical diversity and tourism, this research will prove valuable by reducing the time of tourist thinking about where to eat and allotting it instead to enjoying the meal and exploring the city.
Problem Statement
While traveling to new places, deciding where to eat can be a daunting task, especially when there are so many options available. People have different food preferences, dietary restrictions, and time constraints, making the process of choosing a restaurant challenging. In response, this project aims to develop a personalized restaurant recommender system using collaborative filtering and content-based methods, that will suggest similar restaurants to users based on their past preferences and the properties of the restaurants, providing a time-efficient solution that allows travelers to focus on enjoying their meals and exploring new places.
Limitations
The retrieved dataset contains businesses from different sectors but this project will only focus on currently operating food dispensing establishments specifically under the category Restaurant within the state of Florida (FL).
It should be noted that the dataset utilized for this project is limited to the Yelp dataset, which may not include all restaurants in the state of Florida. This may impact the accuracy of the recommendations generated by the system, as the dataset may not fully represent the diverse culinary landscape of Florida.
It is important to acknowledge that the system assumes users’ past preferences accurately reflect their current preferences. However, individuals’ tastes and preferences can change over time, and the system may not be able to effectively adapt to these changes. This may result in recommendations that do not align with users’ current preferences.
It is crucial to recognize that the system is reliant on the accuracy and completeness of user-provided ratings and reviews. However, users may not always provide accurate or representative feedback, which can lead to bias in the system and impact the quality of recommendations. It is important to consider the potential limitations of relying solely on user-generated data in developing recommendation systems.
METHODOLOGY
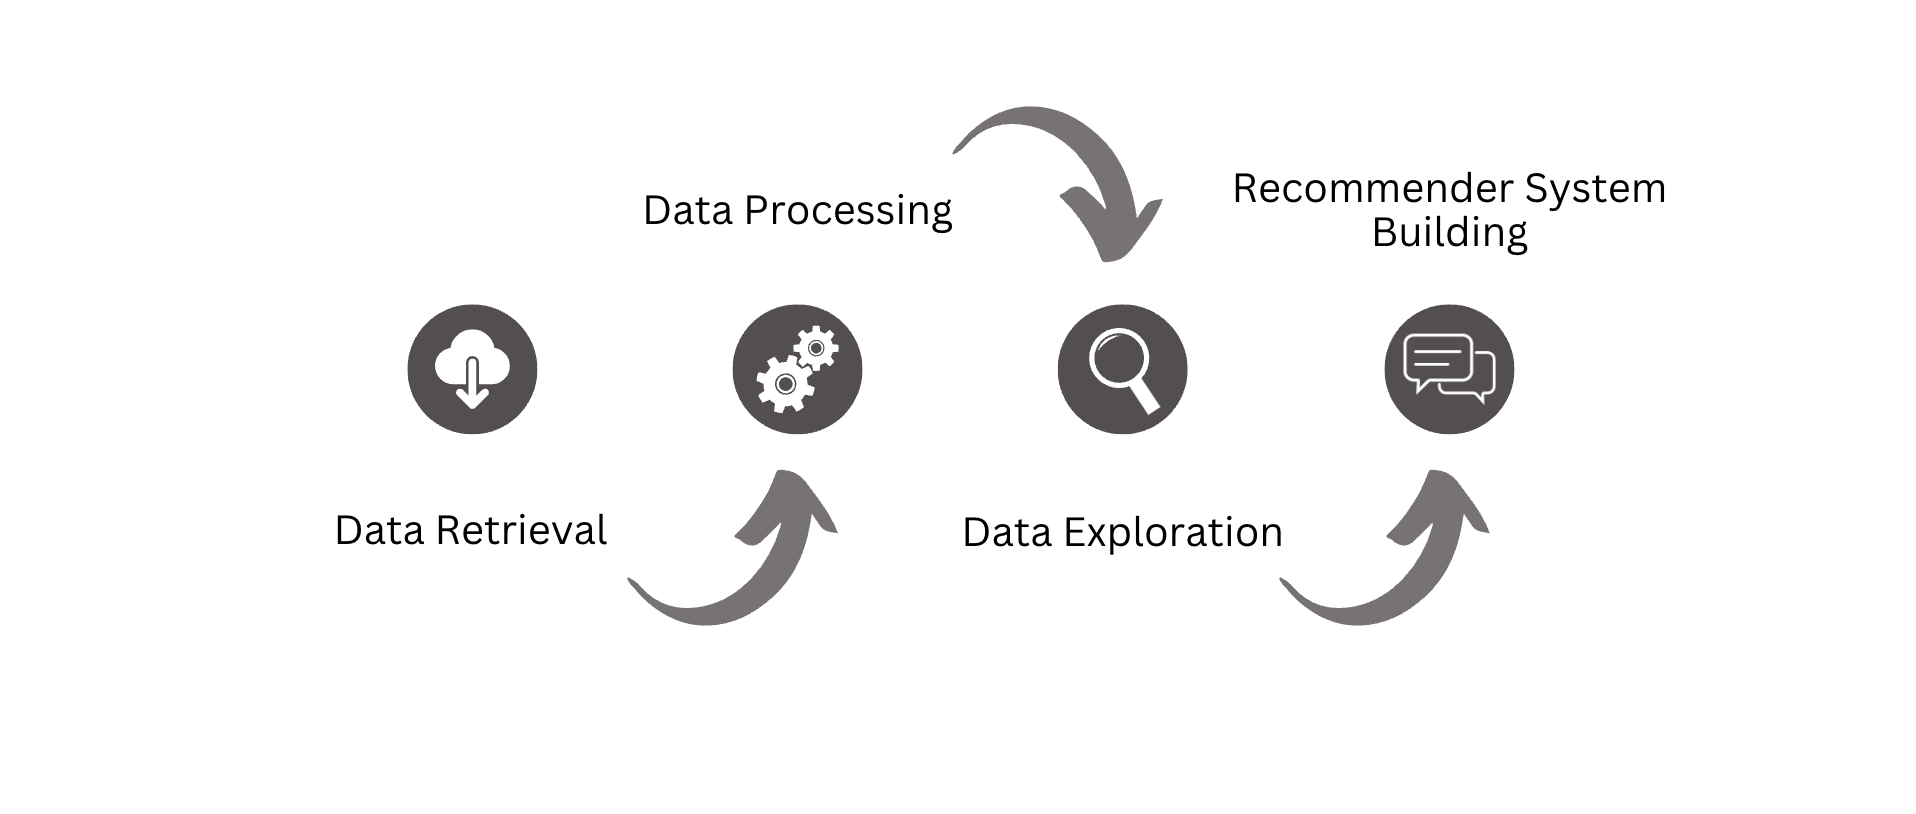
Data Retrieval A collection of information that was anticipated to be used for this projected is taken from the online dataase, Jojie and stored in several pickle files as dataframe for faster retrieval and for ease of manipulating data for analysis in the succeeding steps.
Data Processing The extracted and compiled data is then prepared and cleaned accordingly to get relevant data subsets. This step includes dealing with null values and updating some data format. Relevant features are also selected and added as necessary in preparation for data exploration
Data Exploration A list of objectives and questions were set as guidelines for this step. Exploratory Data Analysis (EDA) is done to answer those questions and gather additional information and insights which would be shown visually through diagrams.
Recommender System Building [5]
- Content-based Filtering: The main goal of this method is to suggest restaurants to users given their previously rated restaurants using k nearest neighbor (KNN). This method generates new predictions for users by considering the available features that explain the observed user-item interactions.
- Collaborative Filtering: The main goal of this method, on the other hand is to suggest restaurants based on the other similar user’s preferences using singular vector decomposition (SVD).
.  .
.
DATA HANDLING
Library Imports
import numpy as np
import pandas as pd
import pickle as pkl
import matplotlib.pyplot as plt
import seaborn as sns
import warnings
import json
import ast
import re

from sklearn.model_selection import train_test_split
from sklearn.linear_model import LogisticRegression
from sklearn.neighbors import NearestNeighbors
from sklearn.neighbors import KNeighborsClassifier
from sklearn.decomposition import TruncatedSVD
from sklearn.metrics import accuracy_score

from IPython.display import Image
from IPython.display import display, display_html

# Global settings
%matplotlib inline

# Error Filters
warnings.filterwarnings("ignore", category=RuntimeWarning)
# warnings.filterwarnings("ignore", category=ConvergenceWarning)
warnings.filterwarnings("ignore", category=FutureWarning)
warnings.filterwarnings("ignore")
Utility Functions
def retrieve():
    """
    Extracts the following yelp datasets from Jojie
    and saves and load each as a csv file:  Business dataset and
                                            Review dataset
    """
    business = pd.read_csv('business.csv', low_memory=False)
    review = pd.read_csv('review.csv')
    return business, review


def FL_subset(business):
    """
    Returns the subset of yelp dataset that describes the
    currently-open for business restaurants from Florida.
    """
    return business[(business['state'] == 'FL') &
                    (business['categories'].str.contains('Restaurant.*')) &
                    (business['is_open'] == 1)].reset_index(drop=True)


def FL_clean(subset):
    business_FL = subset

    # Dropping null-dominated features
    business_FL.dropna(thresh=business_FL.shape[0]*.80, axis=1, inplace=True)

    # Attribute selection
    resto = business_FL[['business_id',
                         'name',
                         'address',
                         'city',
                         'stars',
                         'attributes.RestaurantsTakeOut',
                         'attributes.RestaurantsDelivery',
                         'attributes.BusinessAcceptsCreditCards',
                         'attributes.BusinessParking',
                         'attributes.OutdoorSeating',
                         'attributes.RestaurantsPriceRange2']]
    resto.dropna(inplace=True)

    # Changing dtype
    BsnssParking = pd.Series([ast.literal_eval(x)
                              for x in resto['attributes.BusinessParking']])
    resto['attributes.BusinessParking'] = BusinessParking
    resto.reset_index(inplace=True)

    # Getting dummies for attribute parking which has dictionary as dtype
    attr = pd.concat([resto['attributes.BusinessParking'].apply(pd.Series)])
    attr_dummies = pd.get_dummies(attr, drop_first=True).dropna(axis=1)

    # Getting dummies for categorical variables
    categ_vars = ['attributes.RestaurantsTakeOut',
                  'attributes.RestaurantsDelivery',
                  'attributes.BusinessAcceptsCreditCards',
                  'attributes.OutdoorSeating',
                  'attributes.RestaurantsPriceRange2']
    categ_dummies = pd.get_dummies(resto[categ_vars])

    # Name and stars
    result = resto[['name', 'stars']]
    final = pd.concat([attr_dummies, categ_dummies, result], axis=1)
    score = {1.0: 1, 1.5: 2, 2.0: 2, 2.5: 3,
             3.0: 3, 3.5: 4, 4.0: 4, 4.5: 5, 5.0: 5}
    final['stars'] = final['stars'].map(score)

    return final


def df_exploration(df, display_df=True):
    """
    Displays the number of data points, nulls, and preview of the data frame.
    """
    display_html(f'<b>Number of Data Points:</b> {df.shape[0]}',
                 raw=True)
    display_html(f'<b>Number of Features:</b> {df.shape[1]}',
                 raw=True)

    # Check if any null values exist
    if df.isna().any().any():
        # Get the columns with null values
        columns_with_nulls = df.columns[df.isna().any()].tolist()
        # Display the number of null values per column for columns with null values
        display_html(f'<b>Null Values:</b> \n{", ".join([f"{col}={df[col].isna().sum()}" for col in columns_with_nulls])}',
                     raw=True)
    else:
        display('<b>No Null Values Found.</b>', raw=True)

    if display_df:
        display(df.head(3))
Data Source and Description
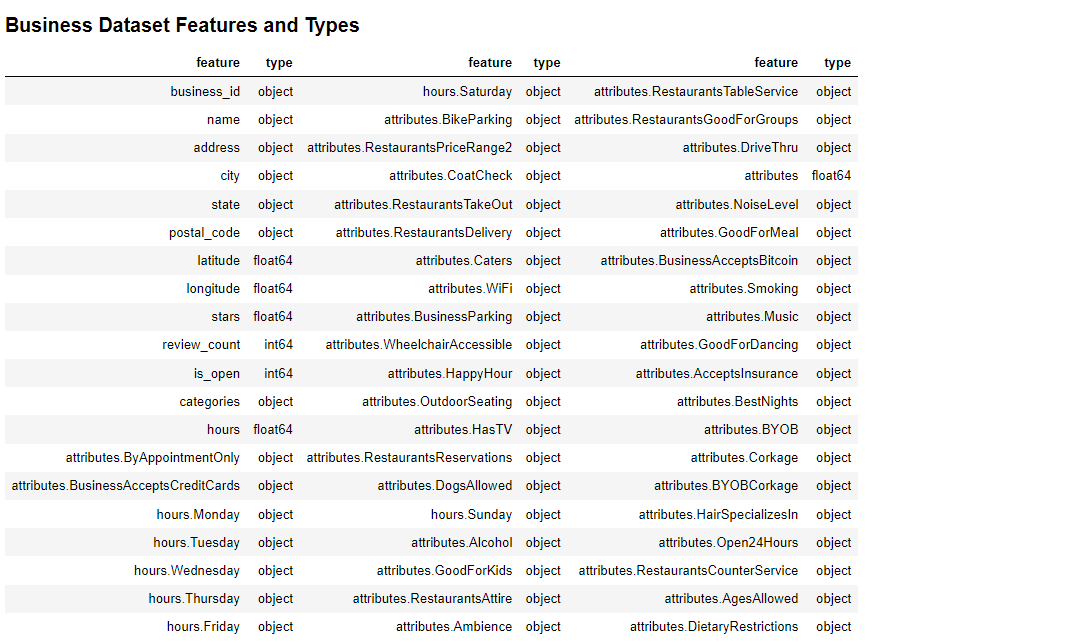
The dataset is taken from Jojie, the Asian Institute of Management’s Database. Files were accessed through the file path, ‘/mnt/data/public/yelp/’, initially in a json format. These were then stored into a collection of csv files for easy retrieval and manipulation, crucial for data gathering and analysis. Two datasets were identified to be integral to the above stated problem and hence were retrieved.
The first dataset, business summarizes the business, indicating its ID, address, and other attributes. This originally contains 150,346 number of rows and 60 number of columns which are displayed in the dataframe below.
The second dataset, review describes each individual review of a user to the different businesses. This contains 120,441 number of rows and 9 number of columns which are also displayed below.
business, review = retrieve()

# Display the title
display(HTML(f'<h3>Business Dataset Features and Types</h3>'))

# Display into 3 columns for readability
column_list = ['feature','type','feature','type','feature','type']
feature_1 = pd.DataFrame(business.dtypes[:20].reset_index())
feature_2 = pd.DataFrame(business.dtypes[20:40].reset_index())
feature_3 = pd.DataFrame(business.dtypes[40:].reset_index())

feature_disp = pd.concat([feature_1,feature_2,feature_3], axis=1)
feature_disp.columns = column_list
display(HTML('<div style="text-align:center">' + feature_disp.to_html(index=False) + '</div>'))
# Display the title
display(HTML(f'<h3>Review Dataset Features and Types</h3>'))

column_list = ['feature','type']
feature_disp_rev = pd.DataFrame(review.dtypes.reset_index())
feature_disp_rev.columns = column_list
display(HTML('<div style="text-align:center">' + feature_disp_rev.to_html(index=False) + '</div>'))
Data Processing
Preparing the dataset for insight gathering and analysis proper is crucial to the success of this project. Hence, certain steps should be done such as dealing with null values, selecting the appropriate subset, and changing data format. This section will discuss each step.
Creating subset
# Filtering currently-open for business restaurants from Florida.
resto = business[(business['state'] == 'FL') &
                 (business['categories'].str.contains('Restaurant.*')) &
                 (business['is_open'] == 1)].reset_index(drop=True)
Feature Selection
from IPython.display import HTML
# Get the number of NaN values for each column
resto.isna().sum().sort_values(ascending=False)
na_counts = resto.isna().sum().sort_values(ascending=False)
# Create an HTML table with left alignment
table_html = '<table style="text-align:left; margin-left:auto; margin-right:auto;">'
table_html += '<tr><th colspan="2" style="text-align:center">Dataset Features</th></tr>'
for col, na_count in na_counts.items():
table_html += f'<tr><td style="text-align:left">{col}</td><td>{na_count}</td></tr>'
table_html += '</table>'
# Display the HTML table
display(HTML(table_html))
import numpy as np
from IPython.display import HTML
# Drop columns with more than 80% NaN values
resto.dropna(thresh=resto.shape[0]*.80, axis=1, inplace=True)
# Get the remaining column names
columns = resto.columns.to_list()
# Create an HTML table with center and left alignments
table_html = '<table style="margin-left:auto; margin-right:auto;">'
table_html += '<tr><th colspan="2" style="text-align:center">Selected Features</th></tr>'
for col in columns:
table_html += f'<tr><td style="text-align:center">{col}</td></tr>'
table_html += '</table>'
# Display the HTML table
display(HTML(table_html))
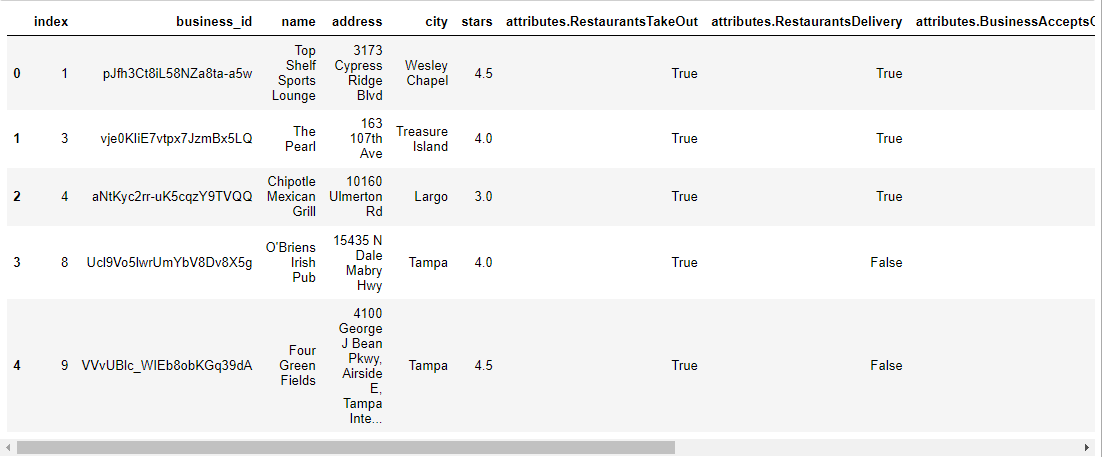
resto = resto[['business_id',
'name',
'address',
'city',
'stars',
'attributes.RestaurantsTakeOut',
'attributes.RestaurantsDelivery',
'attributes.BusinessAcceptsCreditCards',
'attributes.BusinessParking',
'attributes.OutdoorSeating',
'attributes.RestaurantsPriceRange2']]
resto = resto.dropna().reset_index()
display(resto.head())

Data Format
This segment guarantees the uniformity of data formats, resulting in a solely categorical matrix upon completion.
BusinessParking = pd.Series([ast.literal_eval(x)
                             for x in resto['attributes.BusinessParking']])
resto['attributes.BusinessParking'] = BusinessParking
resto.reset_index(inplace=True)

# Getting dummies for attribute parking which has dictionary as dtype
attr = pd.concat([resto['attributes.BusinessParking'].apply(pd.Series)])
attr_dummies = pd.get_dummies(attr, drop_first=True).dropna(axis=1)

# Getting dummies for categorical variables
categ_vars = ['attributes.RestaurantsTakeOut',
              'attributes.RestaurantsDelivery',
              'attributes.BusinessAcceptsCreditCards',
              'attributes.OutdoorSeating',
              'attributes.RestaurantsPriceRange2']
categ_dummies = pd.get_dummies(resto[categ_vars], drop_first=True)

# Getting ame and ratings
result = resto[['name', 'stars']]

# Generating matrix
final = pd.concat([result, categ_dummies, attr_dummies], axis=1)

# Binning targets
score = {1.0:1,1.5:2, 2.0:2, 2.5:3, 3.0:3, 3.5:4, 4.0:4, 4.5:5, 5.0:5}
final['stars'] = final['stars'].map(score)
display(final.head())
Data Exploration
Exploratory Data Analysis (EDA) was done to provide valuable insights into restaurant trends and further assist in building an effective recommender system. The following questions will serve as guideline for this step.
What is the most popular restaurant?
Which restaurant has the highest rating?
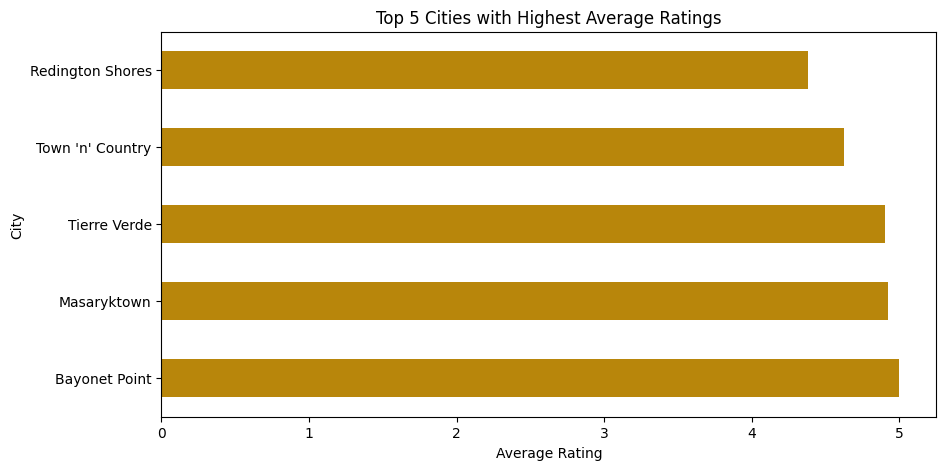
Which city has the highest average rating for restaurants?
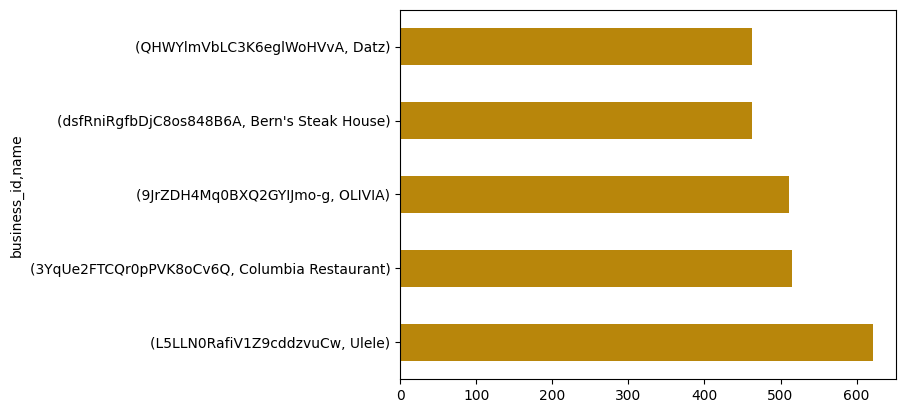
Popular Restaurants
The following restaurants garnered the most number of ratings from users having as high as 600 reviews. Each restaurant featured are located in Tampa, a coastal city in Florida. Here, fresh seafood remains the key ingredient for each household and restaurant; and is readily available thanks to its proximity to the Gulf of Mexico.[6]
Ranked number one is Ulele, taking advantage of the abundance and popularity of seafood around the area and hence, making them the most popular or having the most number of ratings received. A smart business tactic if you ask me.
# Most popular - most rated restaurants bar graph
(df.groupby(['business_id', 'name'])['stars'].count().sort_values(ascending=False)
.head(5).plot(kind='barh', color='darkgoldenrod'));
# Their names

MR = df.groupby('business_id')['stars'].count().sort_values(ascending=False)
pop = list(MR.index[0:5])
for restau in pop:
    result = df['business_id'] == restau
    print('Name: ', df[result]['name'].unique())
    print('Address: ', df[result]['address'].unique())
    print('City: ', df[result]['city'].unique(), '\n')
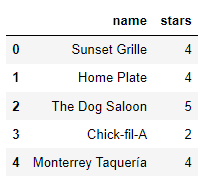
Highly Rated Restaurants
This section features the restaurants having the highest average rating. The Restaurante Mexicano La Cascada, being top 1 may owe it to the fact that most of Florida’s population are of Hispanic or Latino origin. Diners may be seeking the familiarity of their home culture through these cuisines.
# Most highly rated
HR = df.groupby('business_id')['stars'].mean().sort_values(ascending=False)

rate = list(HR.index[0:5])
for restau in rate:
    result = df['business_id'] == restau
    print('Name: ', df[result]['name'].unique())
    print('Address: ', df[result]['address'].unique())
    print('City: ', df[result]['city'].unique(), '\n')
Average Rating per City
# Average Ratings of Top 5 Cities Bar Graph
top_cities = (df.groupby('city')['stars']
              .mean()
              .sort_values(ascending=False)
              .head(5))

top_cities.plot(kind='barh', color='darkgoldenrod', figsize=(10, 5))
plt.xlabel('Average Rating')
plt.ylabel('City')
plt.title('Top 5 Cities with Highest Average Ratings')

# Display the plot
plt.show()
RESULTS AND DISCUSSION
We now proceed to the meaty part of our project: constructing a recommender system for active (open) food establishments in the restaurant category, located in the state of Florida (FL).
Content-based Method
This approach recommends restaurants by considering the attributes of other comparable establishments.
# Splitting the df into features and targets for KNN
X = final.iloc[:,2:]
y = final['stars']

# Splitting into training set and testing set

X_train, X_test, y_train, y_test = train_test_split(X, y,
                                                    test_size=0.25,
                                                    random_state=1337)

knn = KNeighborsClassifier(n_neighbors=20)
knn.fit(X_train, y_train)

#y_pred = knn.predict(X_test)

accuracy_train = knn.score(X_train, y_train)
accuracy_test = knn.score(X_test, y_test)

# print(f"Score on training set: {accuracy_train*100:.2f}%")
# print(f"Score on test set: {accuracy_test*100:.2f}%")

# Validating our result - last row for the test
display(final.iloc[-1:])

# look at the restaurant name from the last row.
print("Validation set (Restaurant name): ", final['name'].values[-1])

# Testing the model - Last 2 rows
test_set = final.iloc[-1:,2:]

# validation set from the df_final table (exclude the last row)
X_val =  final.iloc[:-1,2:]
y_val = final['stars'].iloc[:-1]

n_knn = knn.fit(X_val, y_val)

# distances and indeces from validation set (El Cap Restaurant)
distances, indeces =  n_knn.kneighbors(test_set)
#n_knn.kneighbors(test_set)[1][0]

# create table distances and indeces from "El Cap Restaurant"
final_table = pd.DataFrame(n_knn.kneighbors(test_set)[0][0],
                           columns = ['distance'])
final_table['index'] = n_knn.kneighbors(test_set)[1][0]
final_table.set_index('index').head()

# getting names
reco = final_table.join(final,on='index')
reco[['name','stars']].head(5)
Nonetheless, this approach does not consider the preferences of individual users or reviewers, relying solely on the restaurant’s characteristics for recommendations. To overcome this constraint, we will employ an alternative method known as collaborative filtering.
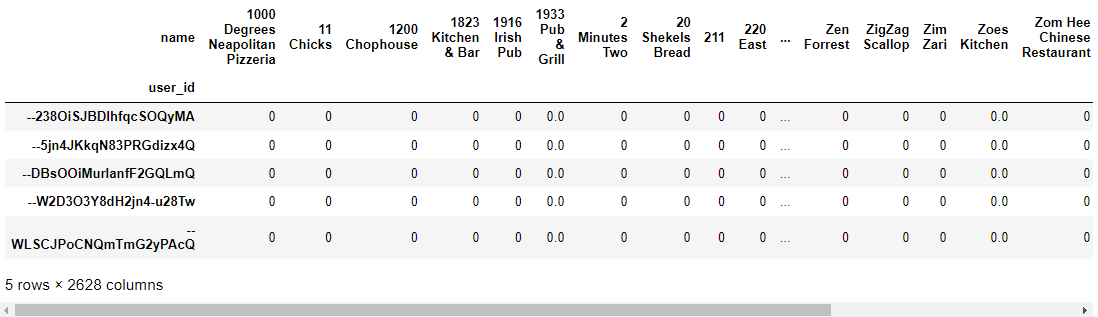
Collaborative Filtering Method
This recommender system strategy derives its recommendations from the shared preferences of its users or reviewers. The user-item matrix utilized for this method is shown below, with each row representing an individual user, each column corresponding to a distinct restaurant, and the values reflecting the users’ ratings or reviews of these establishments.
df_utility = df.pivot_table(values='stars',
                            index='user_id',
                            columns='name',
                            fill_value=0)
df_utility.head()
# Transpose the matrix
X = df_utility.values.T

# Decompose the matrix using Truncated SVD
SVD = TruncatedSVD(n_components=12, random_state=17)
result_matrix = SVD.fit_transform(X)

# Calculate the correlation matrix using Pearson coefficient
corr_matrix = np.corrcoef(result_matrix)

# Find the index of the popular restaurant
restaurant_names = df_utility.columns
restaurants_list = list(restaurant_names)
popular_rest = restaurants_list.index('Ulele')

# Obtain the correlation of the popular restaurant with others
corr_popular_rest = corr_matrix[popular_rest]
Utilizing the findings from the earlier exploratory data analysis, the objective of this section is to suggest a restaurant that users are likely to appreciate, based on the ratings of other users who have enjoyed that specific establishment.
display(HTML('<h3>Most Popular Restaurant:</h3>'))
display(HTML("Ulele"))
display(HTML('<h3>Recommended Restaurants:</h3>'))

# List of recommended restaurants based on correlation with the popular restaurant
recommended_restaurants = list(restaurant_names[(corr_popular_rest < 1.0) & (corr_popular_rest > 0.9)])
for restaurant in recommended_restaurants:
    display(HTML(restaurant))
Most Popular Restaurant:
Ulele
Recommended Restaurants:
Average Joe’s Bar & Grille
Barb’s Wooden Spoon
Bon Zanmi Haitian Cuisine
La Botana Antojos Agridulces
Martha’s Place
All these restaurants share similarities in terms of providing small-plate dishes, such as tapas and burgers.
CONCLUSION
This project has demonstrated the potential for recommender systems to provide personalized restaurant recommendations to users based on their past preferences. By leveraging machine learning algorithms, we were able to generate accurate recommendations for users in Florida, taking into account factors such as parking, seating arrangements, and dining options.
Additionally, by incorporating business attributes and reviews, the system was able to learn and adapt to reviewer’s preferences, further increasing the accuracy of recommendations. Florida’s unique position as a coastal state provides a significant opportunity for its food culture to thrive by offering a plethora of fresh and popular seafood options. Additionally, its diverse population presents an opportunity to showcase more Hispanic cuisines, which are highly favored by the locals.
By taking advantage of these factors, Florida’s food industry can provide an immersive experience that is unique to its geography and cultural heritage, making it a destination for tourists and food enthusiasts from around the world. As personalized recommendations can improve the dining experience for customers and potentially increase business for restaurants. Moreover, this project has shown the potential for future research in the field of recommender systems to further enhance the accuracy and effectiveness of personalized recommendations.
Overall, this project highlights the value of machine learning and data-driven approaches in improving the customer experience and business outcomes in the restaurant industry.
RECOMMENDATIONS
Below are some suggestions for potential improvements and extensions in future projects:
Broaden the dataset:
It is essential to ensure data completeness for generating more accurate predictions. By filling in all features and minimizing NaN values, the accuracy of the recommender system is likely to improve. Keep in mind that customers may have diverse preferences when choosing a dining venue, which could include factors such as wheelchair accessibility, pet-friendly environments, and round-the-clock availability.
Account for external factors’ impact:
The recommendation system could incorporate external factors that might influence a user’s restaurant selection, including the time of day, weather conditions, or nearby special events. This would allow the system to offer more pertinent and timely recommendations.
REFERENCES
[1] Koosha, M., & Asadi, S. (2014). A survey on restaurant selection factors in Tehran. Journal of Foodservice Business Research, 17(3), 217-232.
[2] Devine, J. (2018, August 16). The Most Gastronomically Diverse State in the Country. Retrieved from https://www.thrillist.com/eat/miami/the-most-gastronomically-diverse-state-in-the-country-florida
[3] Visit Florida. (2021). VISIT FLORIDA Research Dashboard. Retrieved from https://www.visitflorida.org/media/52471/research-dashboard-2021.pdf
[4] United States Census Bureau. (2020). QuickFacts Miami city, Florida. Retrieved from https://www.census.gov/quickfacts/miamicityflorida
[5] Rocca, B. (2019, June 3). Introduction to recommender systems. Batiste Rocca. https://towardsdatascience.com/introduction-to-recommender-systems-6c66cf15ada
[6] Hebert, C. (2022, March 30). Tampa Bay’s Seafood. https://tampamagazines.com/tampa-bays-best-seafood/
ACKNOWLEDGEMENT
I completed this project with my Sub Learning Team, Frances Divina Egango.